VIRTIS images mapping ice distribution and temperature


VIRTIS images mapping ice distribution and temperature
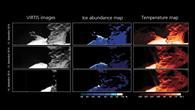
These images, derived from data acquired by the VIRTIS spectrometer on 12, 13 and 14 September 2014 in the visible and near-infrared parts of the spectrum (left column) show that cometary activity depends directly on the temperature underneath the surface of the comet. The white and blue areas in the centre column reveal the highest concentrations of ice (one to five percent and higher); dark blue shows the lowest concentrations (zero to one percent). The images in the right column show the temperatures, which were between minus 130 degrees Celsius and minus 60 degree Celsius.