Anomalies in the total ozone column

Anomalies in the total ozone column
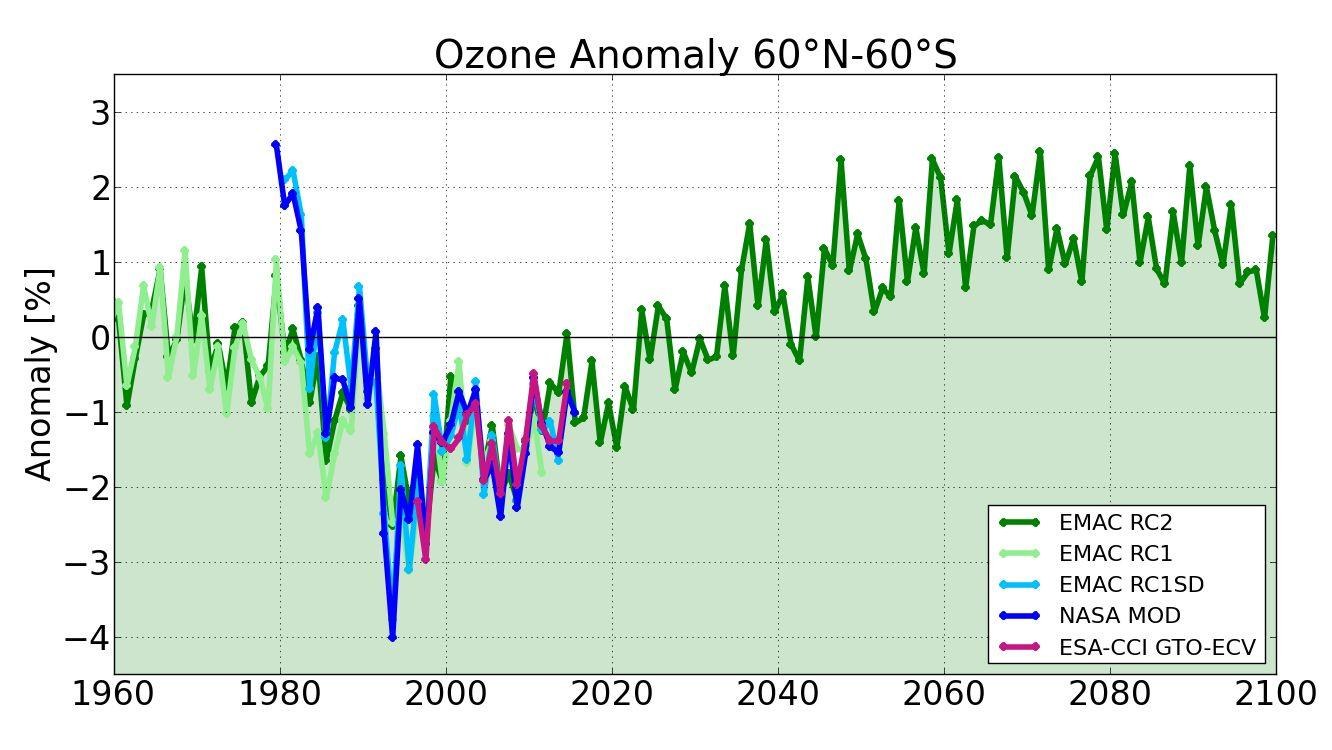
The figure shows anomalies in the total ozone column in the years ranging from 1960 to 1980. The results of three long-term simulations, produced using the atmospheric chemistry model EMAC (for the period from 1960 to 2100), are compared here with matching observations by US-American and European satellite instruments (for the period from 1980 to the present day), operated by NASA or ESA.