
sat_schlag_200.jpg

sat_schlag_200.jpg
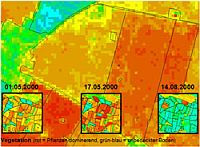
Fig. 1 Overlay of field borders on a LANDSAT 7/ETM+ data set showing the raster structure. A time series of straightforward information products on vegetation growth has also been inserted
Credit: DLR (CC BY-NC-ND 3.0)