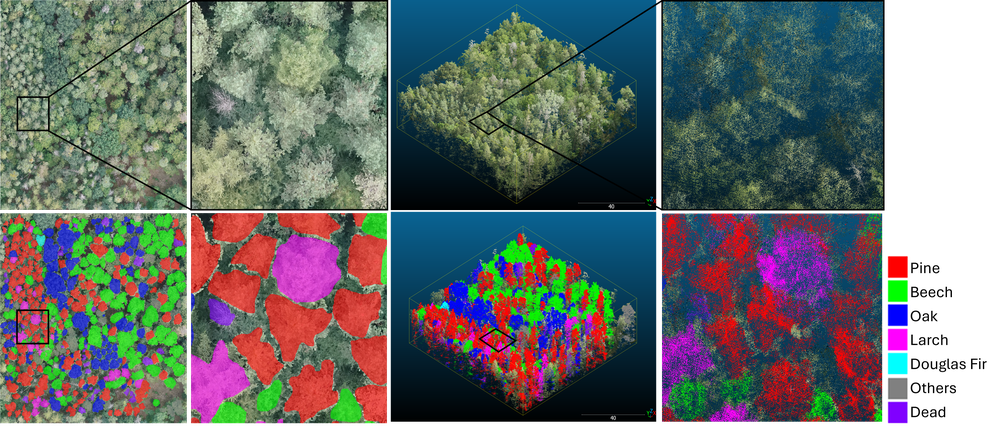
The BAMspecies dataset is the follow-on version of BAMFORESTS dataset with a special focus on tree species classification. BAMspecies combines very high resolution orthomosaics of 2 cm Ground Sampling Distance (GSD) with LiDAR derived point clouds of a total of three AOIs: Stadtwald, Tretzendorf-1, and Tretzendorf-2. The Hain AOI from the BAMFORESTS dataset is not contained in BAMspecies, as EU regulations forbid the use of a larger UAV, capable of carrying LiDAR sensors. The Stadtwald AOI covers 152 hectares and is located approximately 5 kilometres southeast the city center of Bamberg. The area covered by the Tretzendorf-1 AOI is 65 hectares, while the Tretzendorf-2 AOI covers 47 hectares.
In addition to the differences in data modality, in comparison to BAMFORESTS, BAMspecies additionally contains semantic segmented tree species, together with the already published tree instances. All data is provided preprocessed as similar sized plot tiles with the following IDs and corresponding classes: 0 Background, 1 Pine, 2 Beech, 3 Oak, 4 Spruce, 5 Larch, 6 Douglas Fir, 7 Fir, 8 Others, 9 Dead. The tree instances are published with individual IDs for each plot.
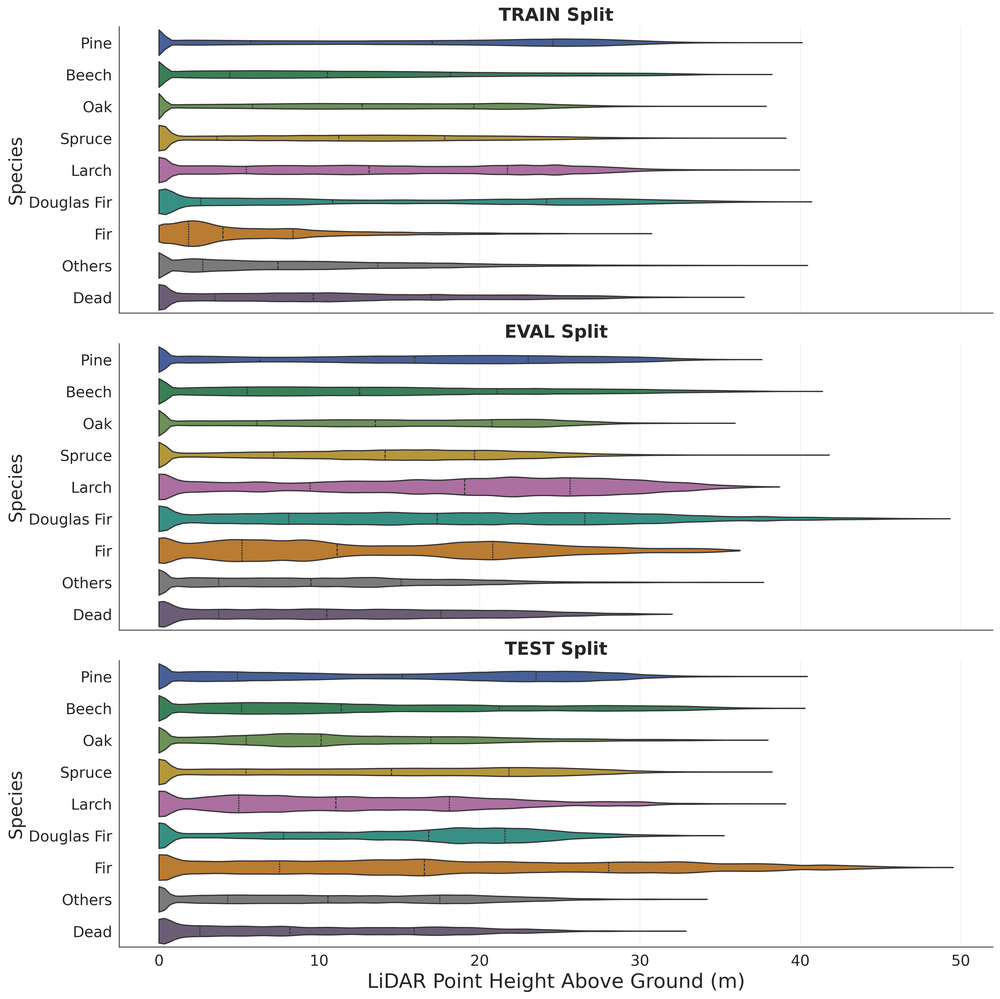
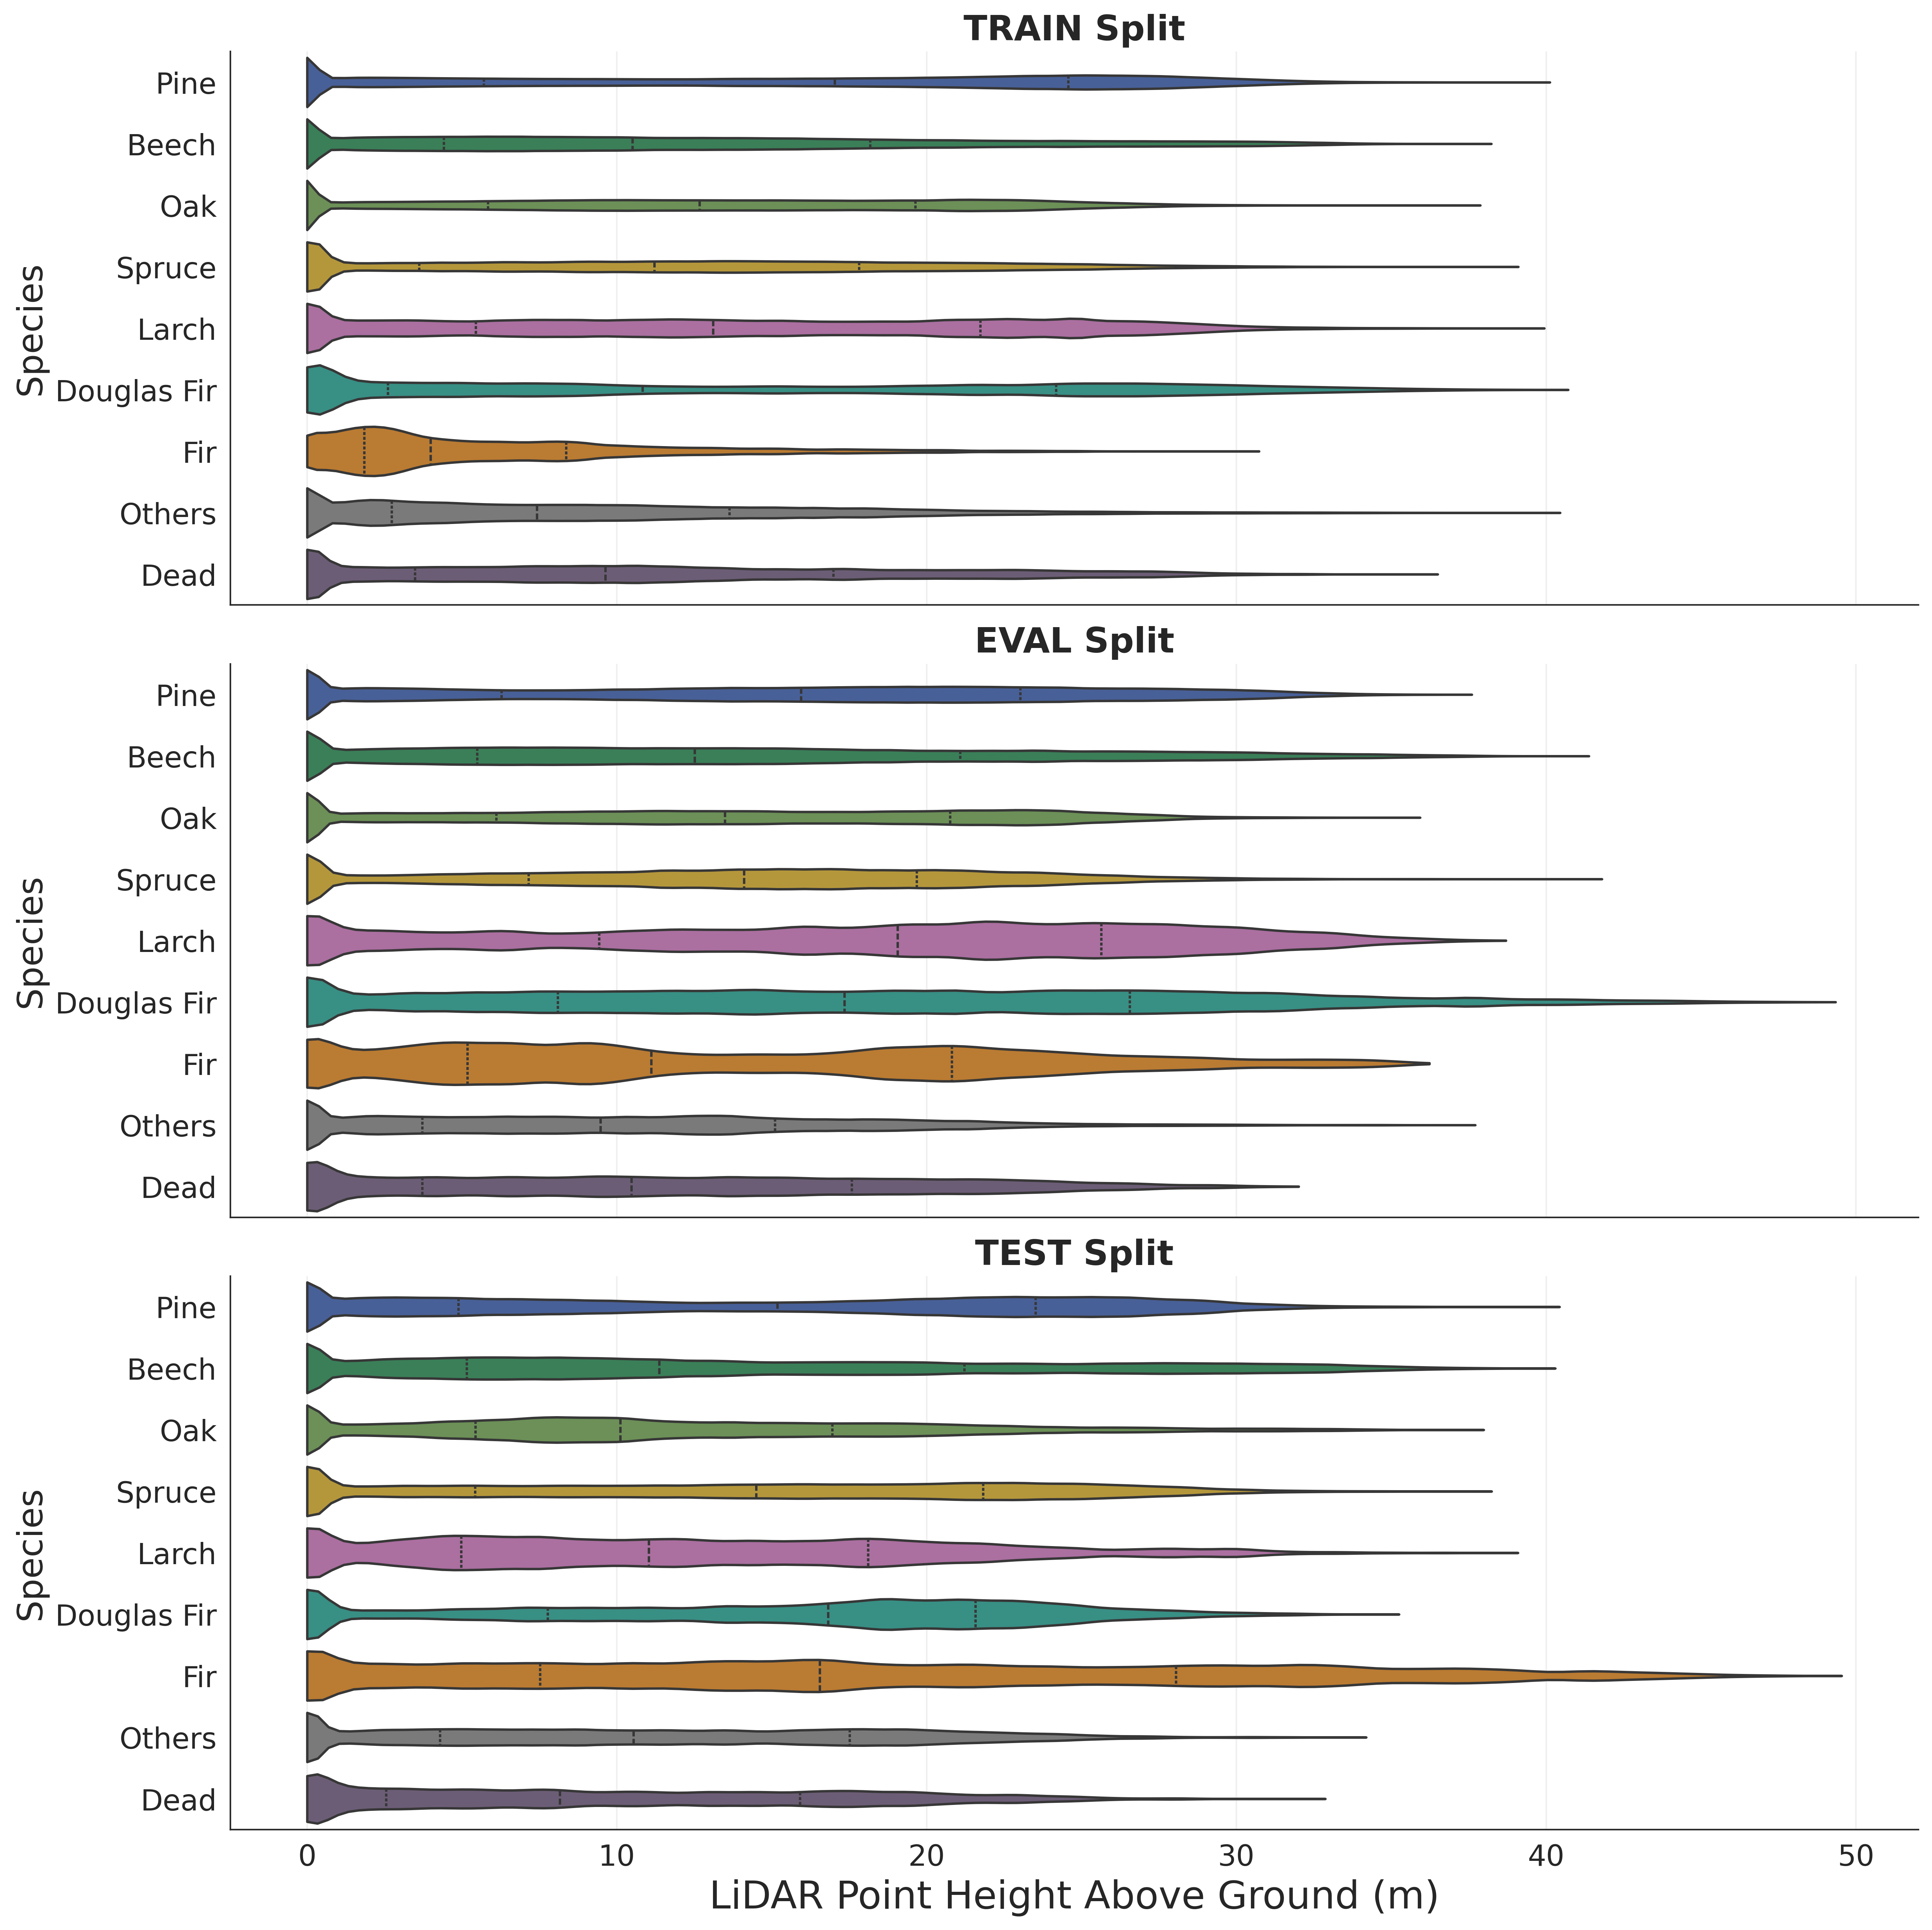
BAMspecies contains 89 patches divided into 60 training patches (train), 16 validation patches (val), and 13 test patches (test) for the 2D data and 76 patches for the 3D data with 51 training patches (train), 14 validation patches (val), and 11 test patches (test) . The same patch identifiers are maintained across the four data modalities to ensure correspondence between the input data and their associated ground-truth annotations.
images_2D/: Contains the image data corresponding to each dataset patch.
masks_treeInstances_2D/: Contains the instance-level ground-truth annotations, where individual object instances are identified separately.
masks_treeSpecies2D/: Contains the semantic ground-truth annotations, providing class-level labels for the scene or objects.
point_clouds_3D/: Contains the point-cloud data corresponding to each patch.
Dataset/
├── images_2D /
│ ├── train/
│ │ ├── Area_01
│ │ ├── ...
│ │ └── Area _20
│ ├── val/
│ │ ├── Area _01
│ │ ├── ...
│ │ └── Area _10
│ └── test/
│ ├── Area _01
│ ├── ...
│ └── Area _10
│
├── masks_treeInstances_2D /
│ ├── train/
│ │ ├── Area _01
│ │ ├── ...
│ │ └── Area _20
│ ├── val/
│ │ ├── Area _01
│ │ ├── ...
│ │ └── Area _10
│ └── test/
│ ├── Area _01
│ ├── ...
│ └── Area _10
│
├── masks_treeSpecies2D /
│ ├── train/
│ │ ├── Area _01
│ │ ├── ...
│ │ └── Area _20
│ ├── val/
│ │ ├── Area _01
│ │ ├── ...
│ │ └── Area _10
│ └── test/
│ ├── Area _01
│ ├── ...
│ └── Area _10
│
└── point_clouds_3D/
├── train/
│ ├── Area _01
│ ├── ...
│ └── Area _20
├── val/
│ ├── Area _01
│ ├── ...
│ └── Area _10
└── test/
├── Area _01
├── ...
└── Area _10
3D point cloud limitations
Available plot numbers of 2D and 3D across the dataset splits. Named plots denote samples for which only 2D data are available.