BAMspecies

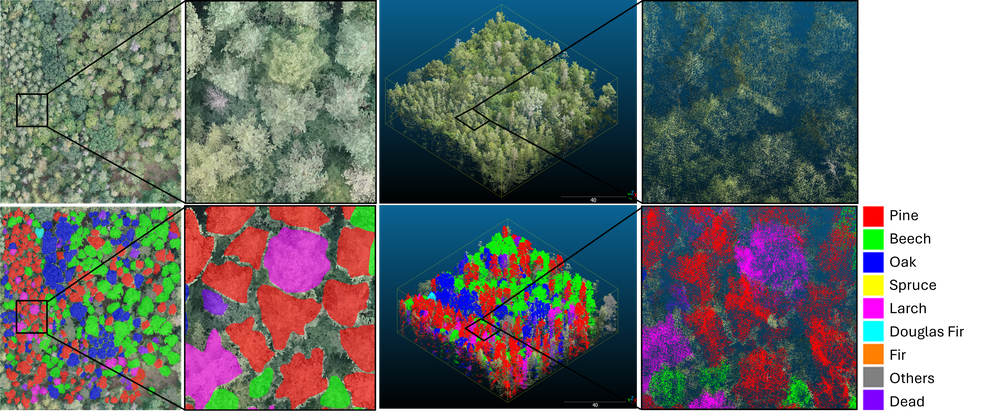
BAMspecies combines ultra-high-resolution RGB imagery with LiDAR point clouds and annotations of individual tree crowns and tree species. It extends the BAMFORESTS dataset with species labels and 3D data, supporting research on individual tree level species classification, tree crown instance segmentation, semantic segmentation, and multimodal learning.

The dataset covers three forest areas in the Bamberg region of Germany. RGB orthomosaics have a ground sampling distance of 2 cm. The release includes 89 image patches and 76 LiDAR point-cloud patches, organized into predefined training, validation, and test splits.

Study areas

Area of interest

Area

Stadtwald

152 ha

Tretzendorf-1

65 ha

Tretzendorf-2

47 ha

Total

264 ha

Stadtwald is located approximately 5 km southeast of Bamberg city center. The Hain area included in BAMFORESTS is not included in BAMspecies.

Annotations and classes

BAMspecies provides individual tree crown annotations and semantic tree species labels. Tree instance IDs are assigned separately within each plot and are therefore not globally unique across the dataset.

Species labels use the following class IDs:

Class ID

Class

0

Background

1

Pine

2

Beech

3

Oak

4

Spruce

5

Larch

6

Douglas Fir

7

Fir

8

Others

9

Dead

Dataset structure

The dataset contains four data components. Each is organized into train, val, and test subfolders.

Folder

Contents

Format

images_2D/

RGB image patches

PNG images with PGW world files

masks_treeInstances_2D/

Individual tree crown instance annotations

ESRI Shapefiles with SHP, SHX, DBF, and CPG files

masks_treeSpecies2D/

Semantic tree species masks

PNG masks with PGW world files

point_clouds_3D/

Labelled LiDAR point clouds

LAS files with Instance_ID and Class_ID attributes

The point-cloud attribute Instance_ID identifies individual tree crowns, while Class_ID identifies the species class.

Dataset/

├── images_2D/

│ ├── train/

│ ├── val/

│ └── test/

├── masks_treeInstances_2D/

│ ├── train/

│ ├── val/

│ └── test/

├── masks_treeSpecies2D/

│ ├── train/

│ ├── val/

│ └── test/

└── point_clouds_3D/

├── train/

├── val/

└── test/

Corresponding data components share the same patch identifiers. However, not every 2D patch has a corresponding 3D point cloud.

Dataset splits

The 2D dataset contains 60 training patches, 16 validation patches, and 13 test patches. The 3D dataset contains 51 training patches, 14 validation patches, and 11 test patches.

Corresponding 2D and 3D patches follow the same spatial split assignment. Use the predefined splits for reproducible evaluation.

Patch identifiers

The numeric identifiers below correspond to the Area_XX patch names.

Split

2D patches

Area identifiers

Train

60

02, 04, 05, 06, 07, 10, 12, 13, 14, 16, 18, 19, 20, 21, 22, 24, 25, 26, 27, 30, 31, 33, 34, 35, 36, 38, 39, 40, 43, 44, 46, 47, 48, 49, 50, 51, 52, 53, 56, 57, 60, 61, 64, 67, 68, 69, 70, 72, 74, 75, 76, 78, 79, 80, 81, 84, 86, 87, 88, 89

Test

13

01, 03, 08, 15, 23, 41, 42, 55, 59, 62, 63, 65, 73

Availability of corresponding 3D data

Split

2D patches

3D patches

Patches without corresponding 3D data

Train

60

51

Area_47, Area_50, Area_51, Area_52, Area_56, Area_67, Area_74, Area_88, Area_89

Validation

16

14

Area_82, Area_85

Test

13

11

Area_42, Area_55

Total

89

76

13 patches

Preprocessing

The 2D tiles are generated using a moving-window approach with 50% overlap in both horizontal and vertical directions. No padding or additional edge handling is applied.

LiDAR data retain their original georeferenced coordinates and are provided as point clouds with per-point instance and species labels.

For experiments combining RGB imagery and LiDAR, match the data by patch identifier and use only patches with both modalities available. Preserve the predefined split assignments when preparing training and evaluation data.

Known limitations

  • Incomplete 3D coverage: Thirteen image patches do not have corresponding LiDAR point clouds. These patches must be excluded from experiments requiring paired 2D and 3D inputs.
  • Area_64: The dataset documentation reports a difference between the 2D and 3D representations of this area related to data quality. Inspect this patch before using it for paired training and exclude it if the discrepancy affects the experiment.
  • Class imbalance: Species classes are not equally represented, and their proportions vary between splits and modalities.
  • Plot-local instance IDs: Instance IDs identify trees within individual plots and should not be interpreted as globally unique tree identifiers.

Getting started

  1. Download the data components required for your task from HuggingFace https://huggingface.co/datasets/MareikeW/BAMspecies.
  2. Retain the train, val, and test folder structure.
  3. Keep PGW world files alongside their corresponding PNG files and retain all supplied Shapefile components.
  4. Read semantic masks as class-ID labels.
  5. For LiDAR data, use Instance_ID for individual tree crowns and Class_ID for species labels.
  6. For multimodal experiments, match patches by identifier and check the 3D availability table.

License

cc-by-nc-nd-4.0

If you would like to use this data for commercial purposes or refine our data for a new release, please contact us.

Citation

Weishaupt, M., Fan, W., Ben Ghorbel, Y., Panangian, D., Troles, J., Schmid, U., & Tian, J. (2026). *BAMspecies: A Benchmark Dataset for Individual Tree Species Classification from Ultra High-Resolution RGB Imagery and LiDAR Point Cloud*. ACCV, Osaka, 2026.

Links

Contact

Dr. Stefan Auer

Head of Department
Remote Sensing Technology Institute
Photogrammetry and Image Analysis
Oberpfaffenhofen, 82234 Weßling