
Processed VLF signal amplitudes

AARDDVARK (Antarctic-Arctic Radiation-belt (Dynamic) Deposition VLF Atmospheric Research Konsortia) is a global network of receivers that provides continuous, long-range observations of the lower ionosphere (Clilverd et al. 2009).
The AARDDVARK sensors receive the signal amplitudes and phases of preexisting VLF (Very Low Frequencies, 3-30 kHz) transmitters. These raw data are made available to the public via a database maintained by the British Antarctic Survey.
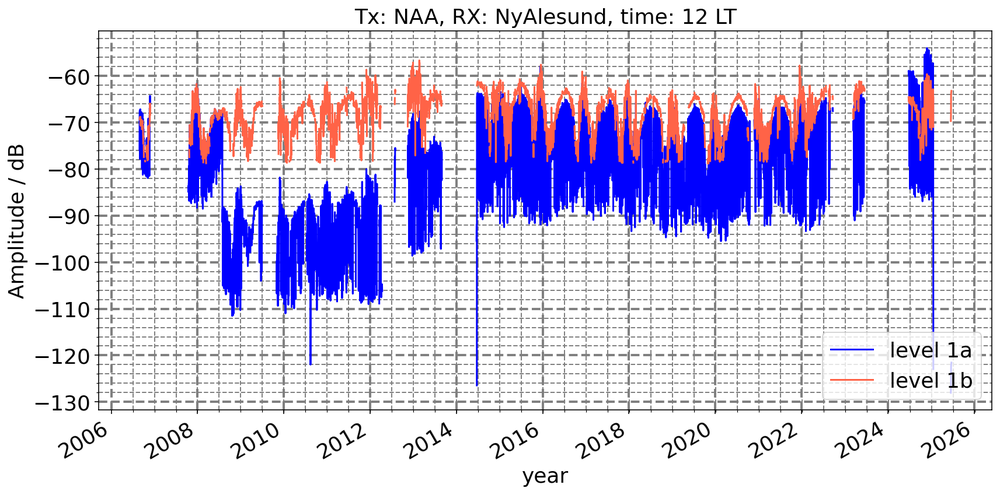
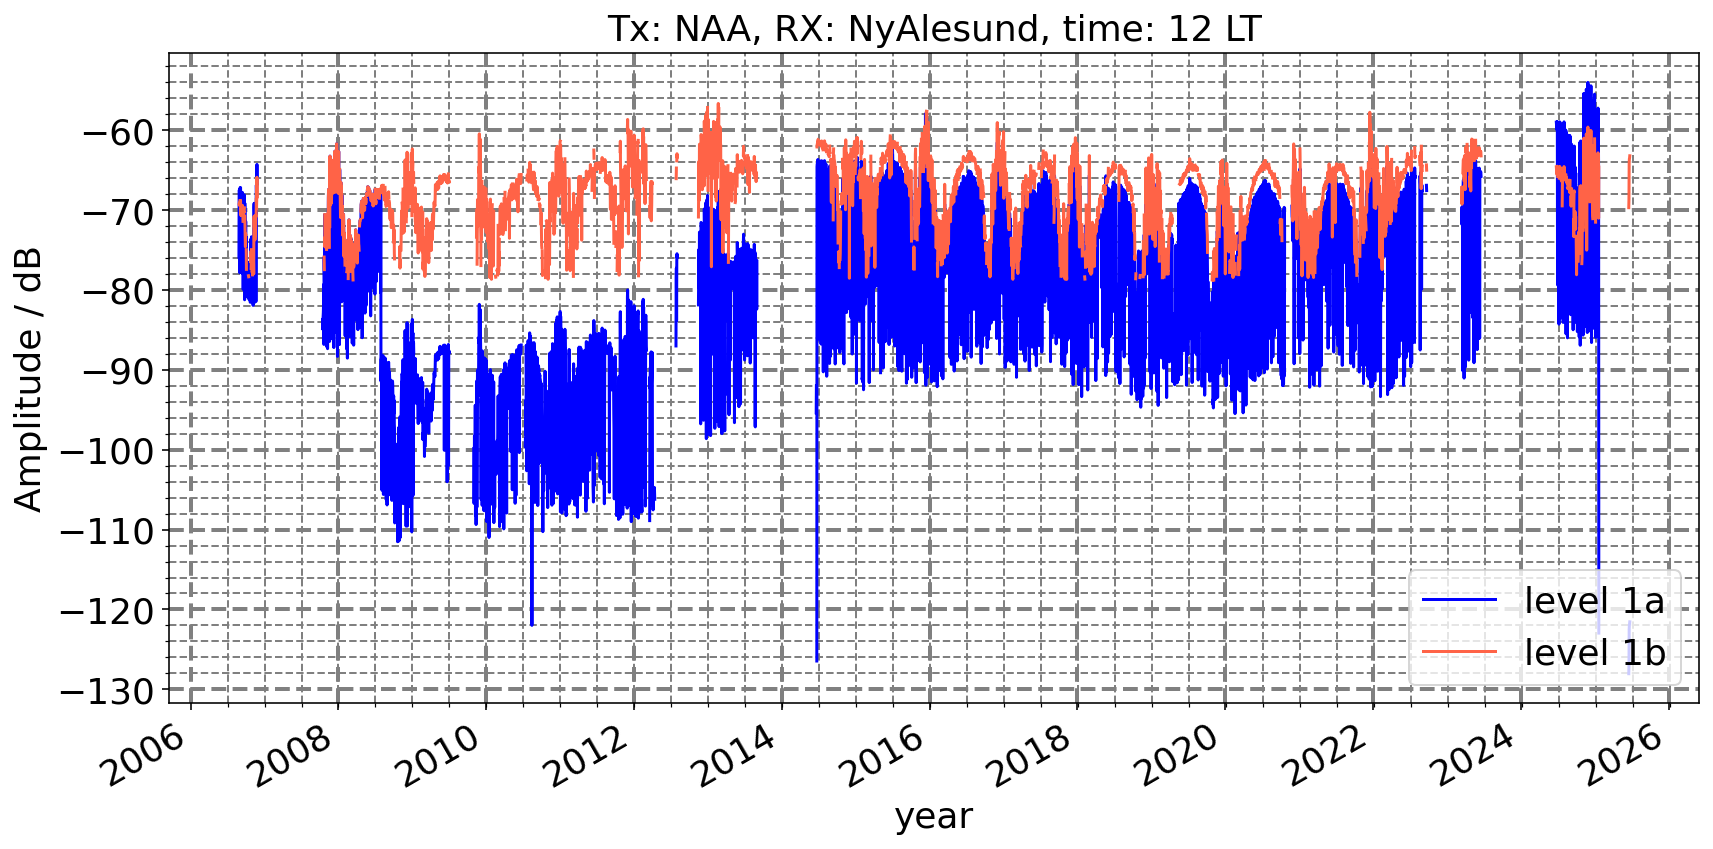
Time series of the raw VLF signal amplitude data show several significant artificial amplitude jumps caused by maintenance. Furthermore, the raw amplitude data are disturbed by regular (e.g., weekly) as well as irregularly occurring outliers due to maintenance and technical issues. Schneider et al. (2024) describe a new approach to handle artificial amplitude jumps and remove outliers. The systematic processing approach uses 10-minute medians of the raw data as input (denoted Level_1a_10min) and produces the processed Level_1b_10min VLF signal amplitude data.
Here, we provide Level_1a_10min and Level_1b_10min VLF signal amplitude datasets for various receiver-transmitter links, based on the raw VLF signal amplitude data provided and owned by the AARDDVARK members.
Further links
- Clilverd et al., 2009: https://doi.org/10.1029/2008SW000412
- Schneider et al. 2024: https://doi.org/10.1029/2023RS007834
- Datenbase Level 0, British Antarctic Suvey: https://psddb.nerc-bas.ac.uk
- Dataset Level 1a and 1b: Processed VLF signal amplitude datasets (Level_1a_10min and Level_1b_10min)