
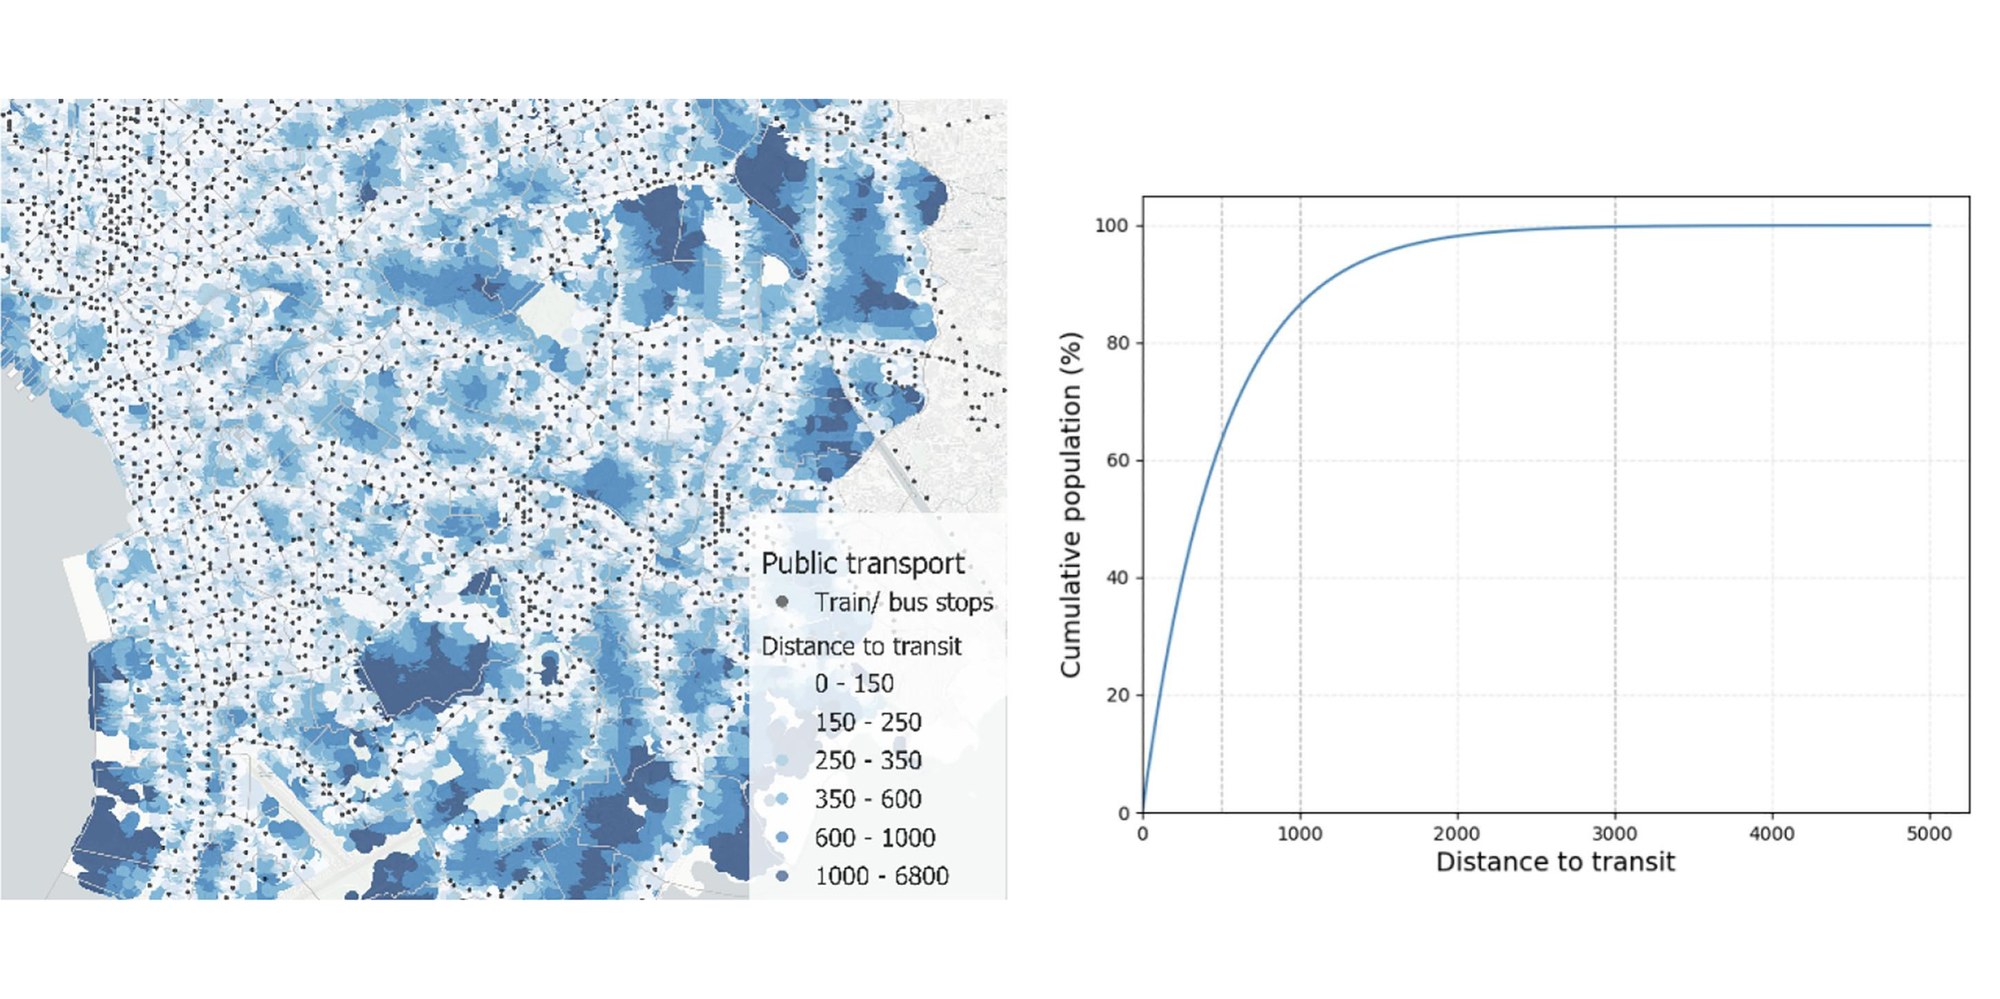
Exemplary results of PtAC calculations for the city of Manila

Exemplary results of PtAC calculations for the city of Manila
On the left, the spatial distribution of population points and the computed distances to the nearest public transport stop are shown in blue. Right: Cumulative population share by distance to public transport.