Skip to main content
Skip to navigation
Skip to footer
DLR Portal
Press
Accessibility
de
en
Institute of
Lightweight Systems
About us
About us
▾
The Institute
▾
Quality management system
▾
Departments
▾
Multifunctional Material
▾
Structural Mechanics
▾
Composite Design
▾
Composite Process Technology
▾
Adaptronics
▾
Sustainability Technologies
▾
Innovation
▾
Central Services
▾
Business areas
▾
Business area Wind
▾
Business area Transport
▾
Business area Wing
▾
Business area Space
▾
Business area Fuselage
▾
Strategic fields
▾
Hydrogen strategy field
▾
Digitalisation strategy field
▾
AddComps® - Additive Composite Structures strategy field
▾
From overall design to certification strategic field
▾
Locations & Arrival
▾
Directions to the Braunschweig site
▾
Directions to the Stade site
▾
Directions to the Bremen site
Research & Transfer
Research & Transfer
▾
Projects & Missions
▾
Cooperation opportunities
▾
Service Desk
▾
DLR Wissenswelt® Leichtbau
▾
Research infrastructure
▾
Start-ups
▾
Software solutions
▾
Technical articles
▾
2026
▾
2025
▾
2024
▾
2022
News
News
▾
News
▾
Events
Media
Media
▾
Publications
▾
Innovation reports
▾
Scientific publications
▾
Handouts, Fact Sheets & One Pager
▾
Images
▾
Video
Career & Young Talents
Career & Young Talents
>
Media
>
Images
>
Images Article/News
>
>
Articles Images Archive General
>
Sensor signals from the SHM system
Home
>
Media
>
Images
>
Images Article/News
>
Articles Images Archive General
>
Sensor signals from the SHM system
Sensor signals from the SHM system
Sensor signals from the SHM system
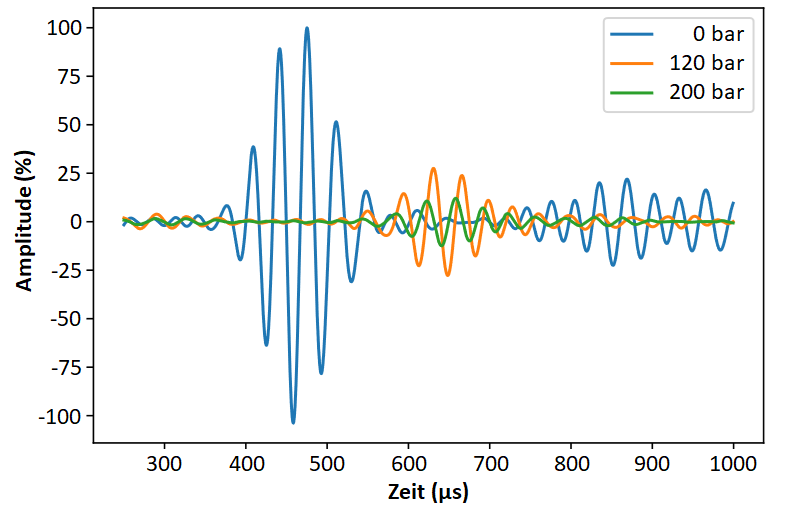
Sensor signals from the SHM system at different tank pressures
Credit:
DLR (CC BY-NC-ND 3.0)