From Pressure Measurements to Flutter Analysis: How We Investigate the Aeroelastic Behavior of Blades in the Non-Rotating Annular Test Facility (Ringgitterprüfstand Göttingen, RPG)
From Pressure Measurements to Flutter Analysis: How We Investigate the Aeroelastic Behavior of Blades in the Non-Rotating Annular Test Facility (Ringgitterprüfstand Göttingen, RPG)
July 18, 2025 | Article series "Non-Rotating Annular Test Facility" - part 3
From Pressure Measurements to Flutter Analysis: How We Investigate the Aeroelastic Behavior of Blades in the Non-Rotating Annular Test Facility (Ringgitterprüfstand Göttingen, RPG)
In our previous technical post from the “Article series Non-Rotating Annular Cascade Test Facility”, we explained why aeroelastic investigations in wind tunnels are crucial for understanding and preventing flutter – and how the Non-Rotating Annular Test Facility plays a central role in analyzing the aeroelastic behavior of turbomachinery blades. In this article, we focus on the practical side: How are pressures and blade movements measured? And how can we derive aerodynamic damping and flutter risks from them?
Why Measure – When You Can Simulate?
Modern CFD simulations provide detailed insights. However, especially in the transonic regime, they face physical and modeling limitations. Nonlinear interactions between shock waves and blade vibrations can occur here – and these are extremely challenging to capture computationally. Carefully designed experiments provide essential reference data – both to validate simulations and to deepen our understanding of aeroelastic phenomena.
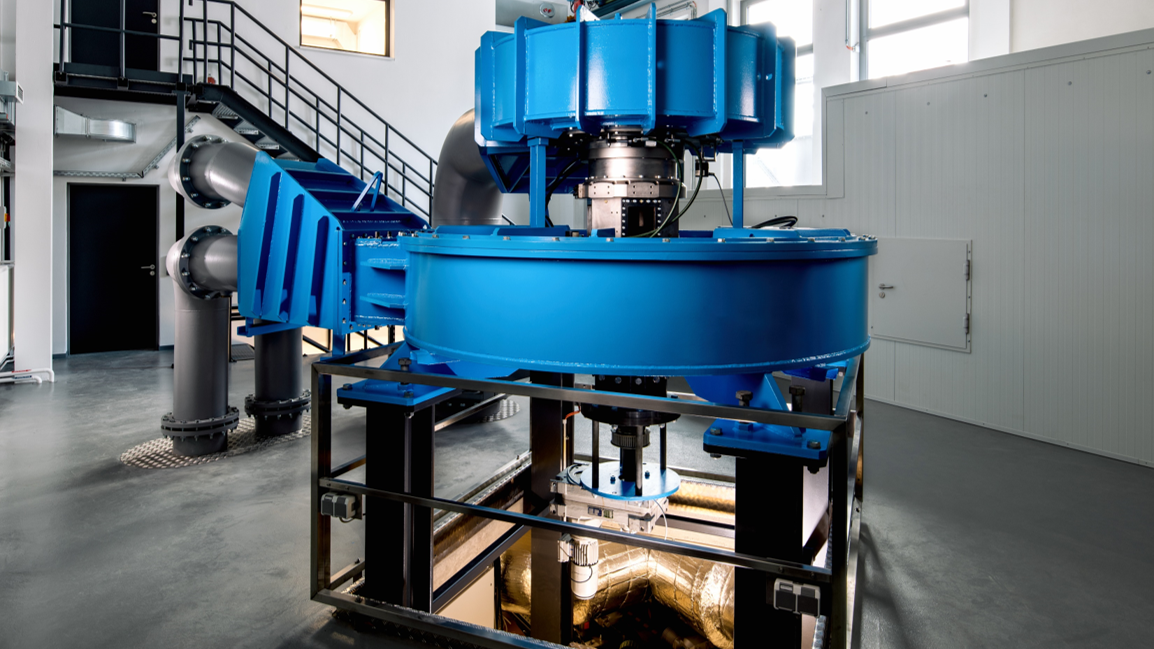
The Measurement Cascade – Heart of the Annular Test Rig
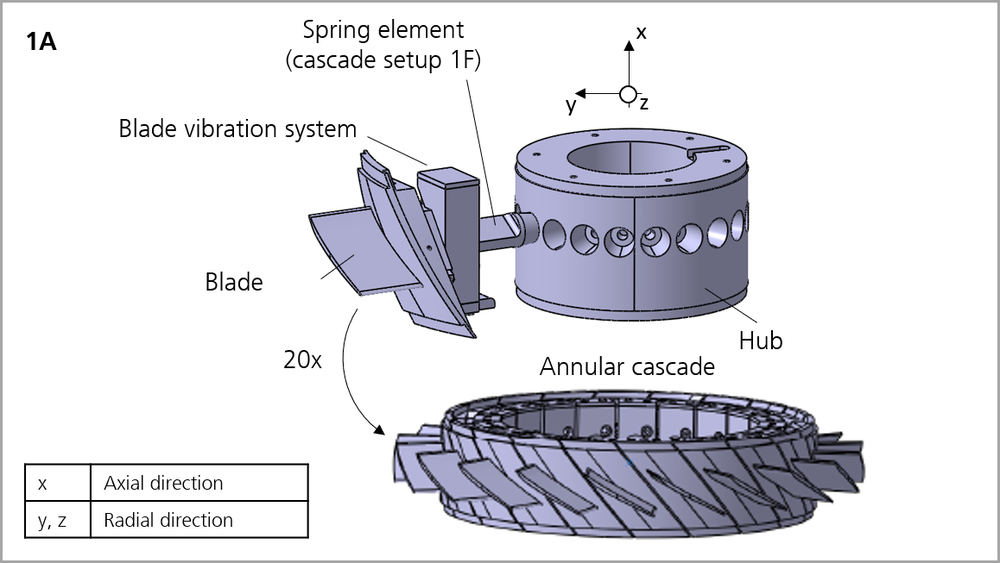
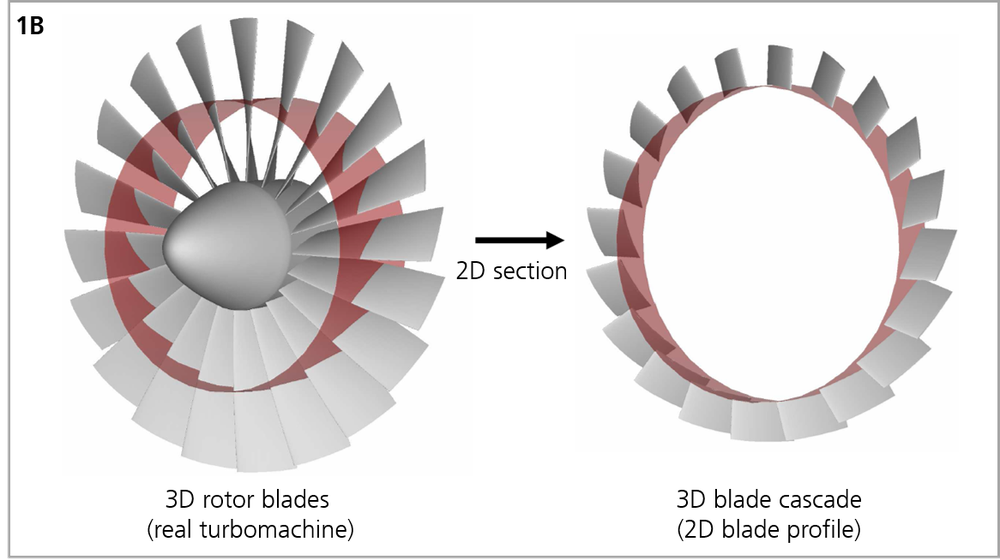
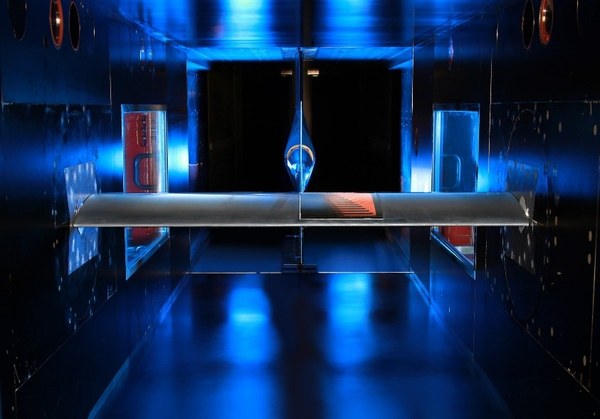
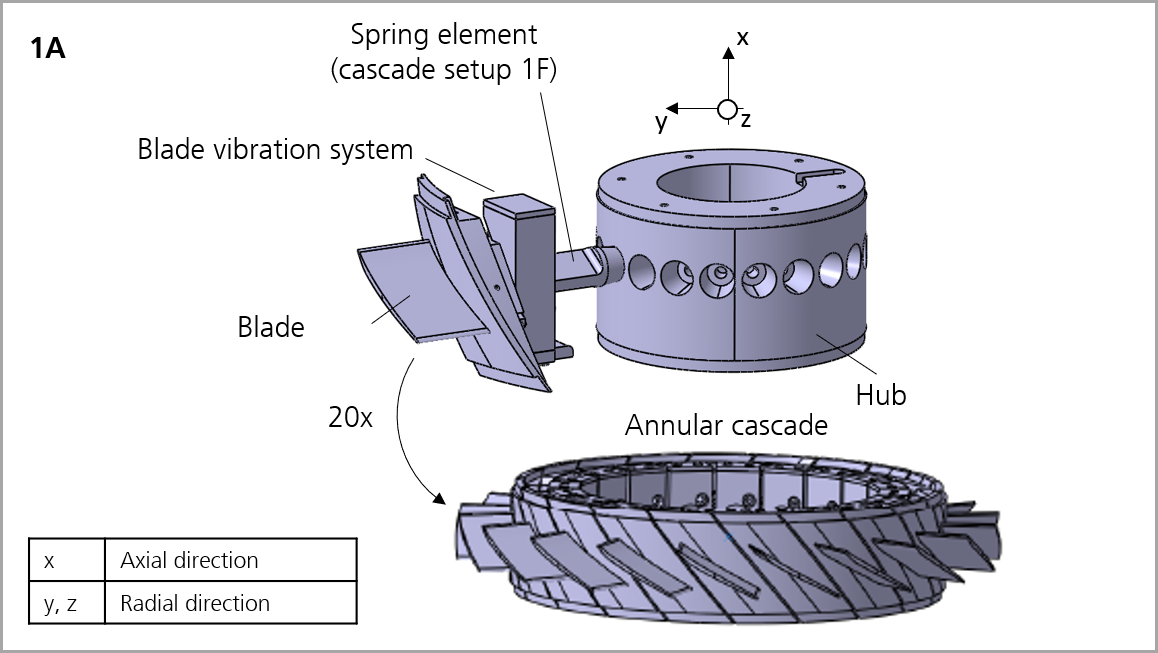
At the core of our measurement campaigns is a ring-shaped blade cascade with 20 individually excitable blade vibration systems (Fig. 1A). This test model or “annular cascade” represents a 2D blade cross-section of a rotor blade, extruded to a length of 40 mm (Fig. 1B) – essentially a representative slice of a real 3D rotor blade.
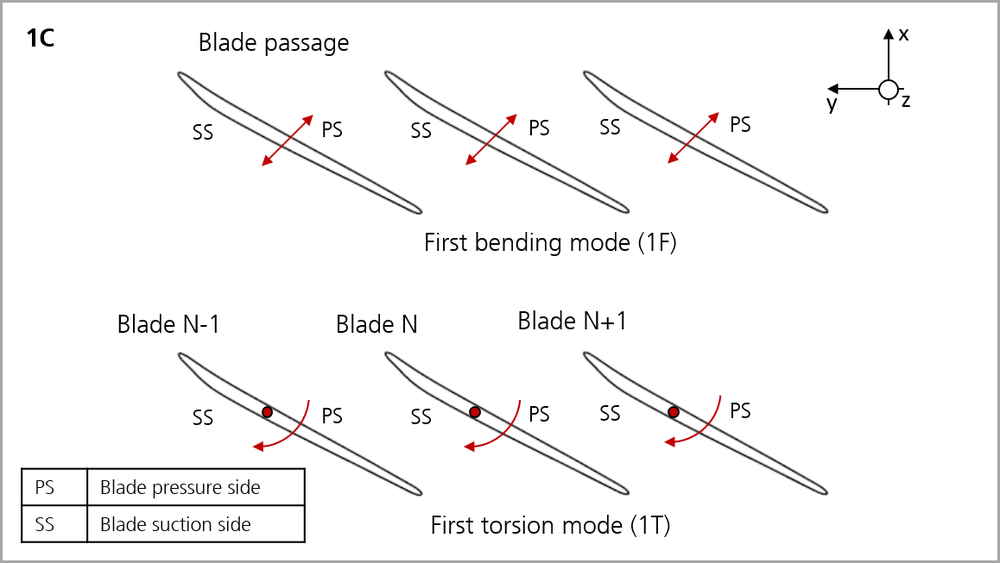
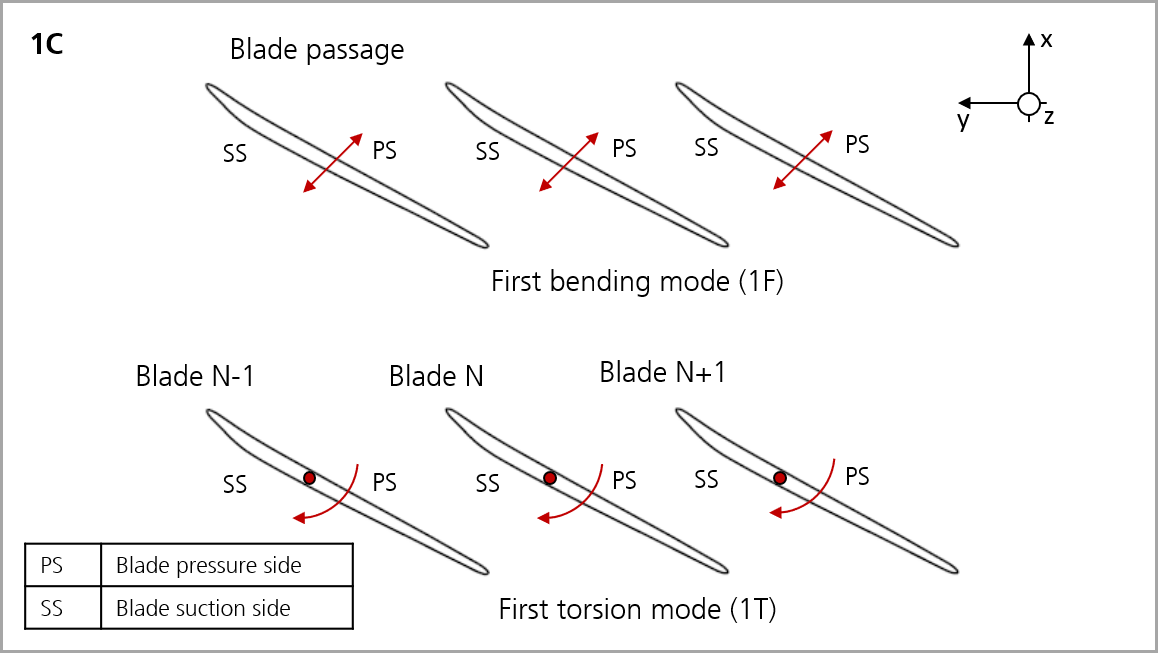
Each blade can be set to vibrate in two distinct structural modes (Fig. 1C):
1F (Flap Mode) – Bending perpendicular to the blade chord line
1T (Torsion Mode) – Twisting around the blade axis
These modes are achieved using custom-designed spring elements (Fig. 1B). For each mode – 1F (bending) and 1T (torsion) – a dedicated annular cascade setup is assembled. This approach ensures consistent and comparable datasets under identical flow conditions.
Figure 1A: Schematic view of a complete annular cascade with 20 individually excitable blade vibration systems arranged in a ring
First, the blades are locked using a hydraulic brake. In this fixed state, we can set and measure steady-state flow conditions.
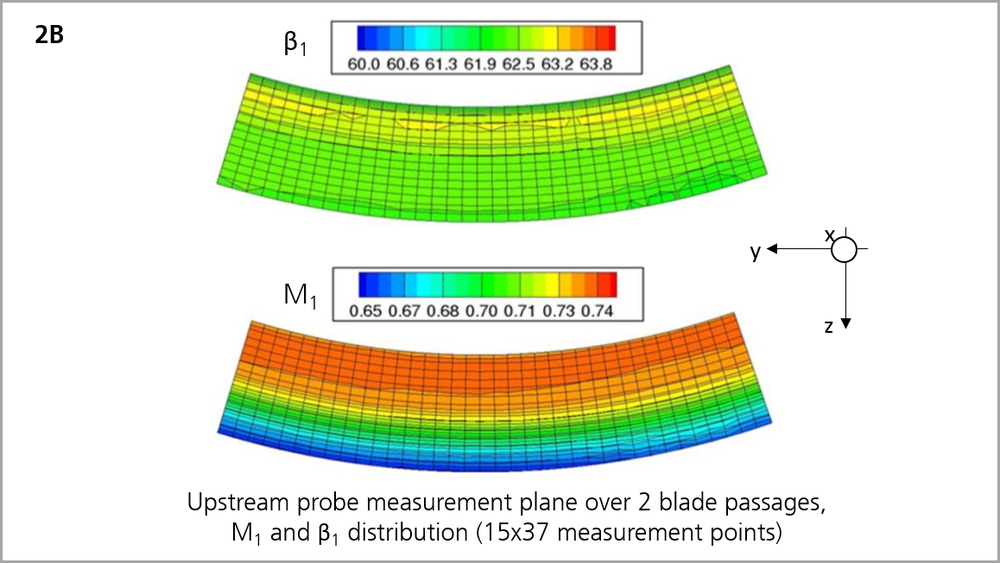
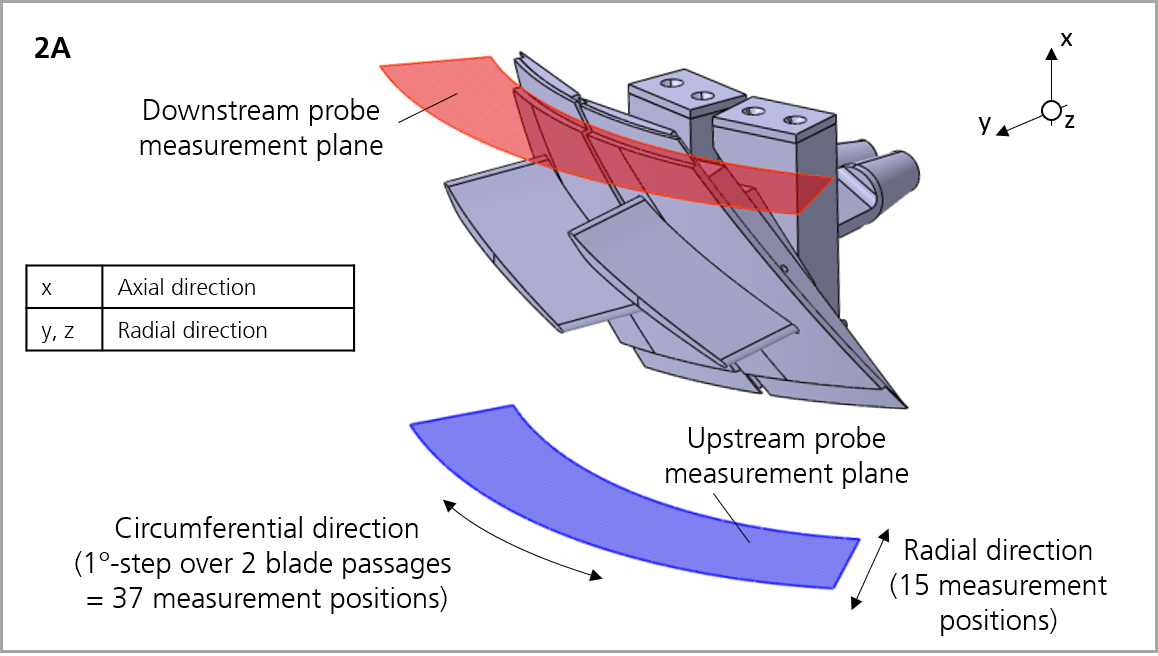
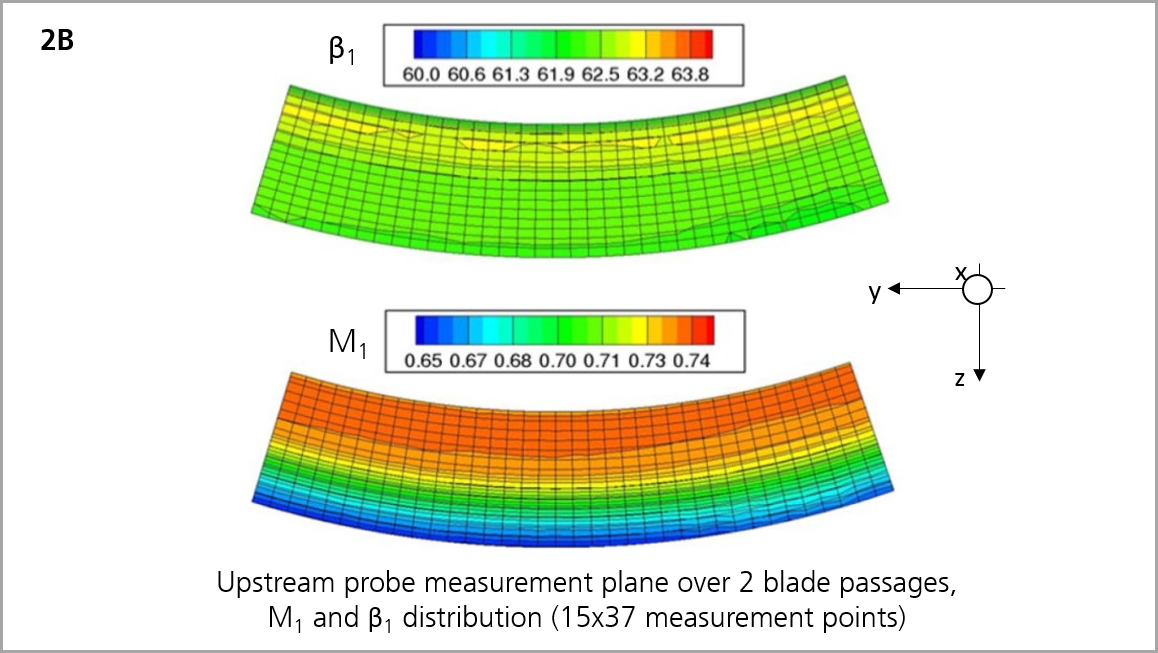
Two aerodynamic probes scan the flow field upstream and downstream of the annular cascade. By pivoting the cascade and adjusting the probes radially, we gather data at 15 radial positions and in 1° steps across two blade passages (Fig. 2A). This creates a high-resolution map of Mach number and inflow angle in one axial plane (Fig. 2B). Measuring across two adjacent passages allows us to assess flow periodicity and better identify local disturbances.
Unsteady Measurements: Controlling and Capturing Blade Motion
Next, we excite the cascade into vibration: The hydraulic brake is released, and displacement sensors begin tracking amplitude and phase of each blade’s motion in real-time.
Each blade is excited at its natural frequency – depending on the cascade setup, either in 1F or 1T mode. A central reference oscillator provides the excitation signal, distributed evenly across 20 blades. By adjusting and regulating the interblade phase angle (IBPA) and ensuring uniform amplitude, a traveling wave pattern emerges – like a "wave" in a stadium (Fig. 2C). This simulates realistic vibrations found in actual turbomachinery.
Figure 2A: Representation of the measurement planes upstream and downstream of the annular cascade, with radially adjustable probes for high-resolution capture of the flow field across two blade passages
Figure 2B: Example measurement data from the upstream flow field – visualization of the inlet Mach number and inlet flow angle fields over two adjacent blade passages
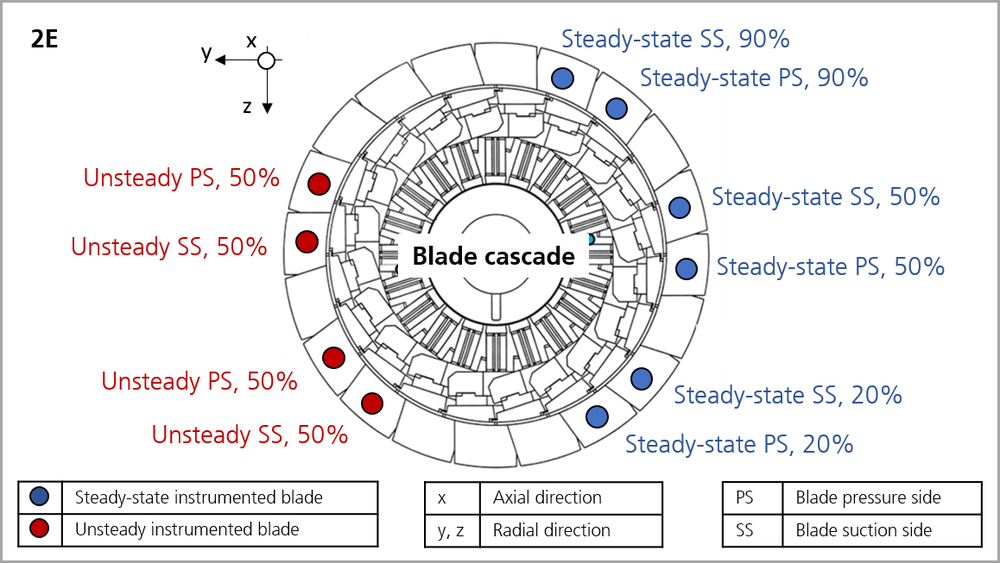
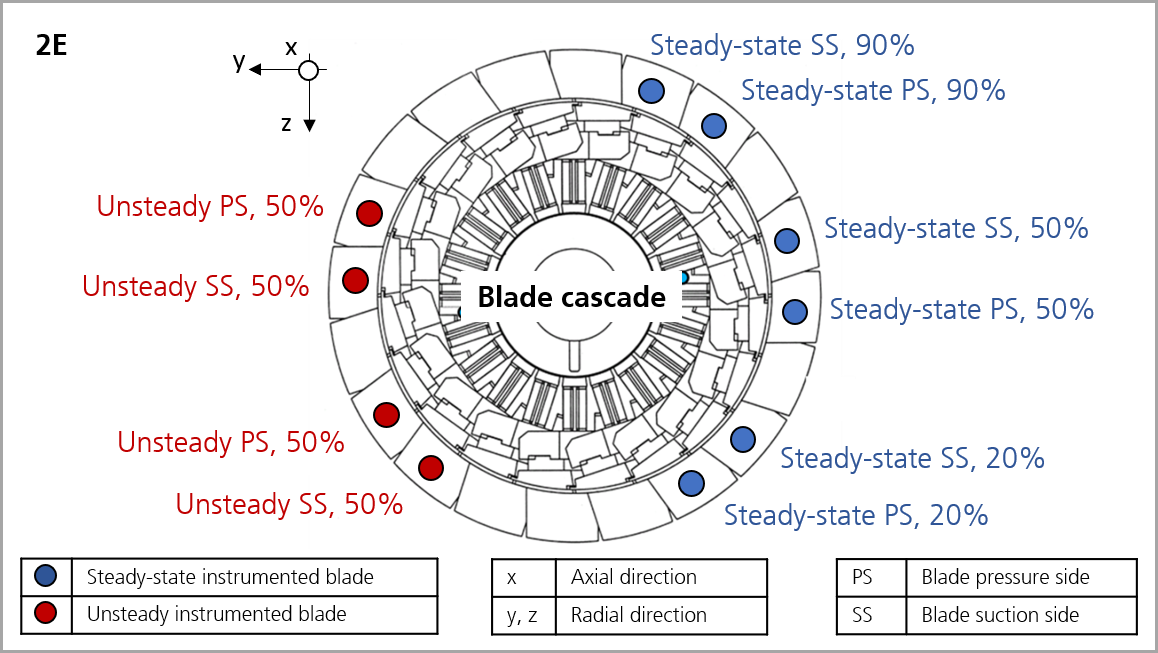
Figure 2E: Example of an instrumentation strategy – Combination of steady and unsteady pressure measurement positions on selected blades to capture the aerodynamic forces
Aerodynamic forces on the blade surfaces are captured using:
Steady-state pressure taps: Six blades are equipped with static pressure taps on both blade pressure and suction sides – located at 20%, 50%, and 90% blade height along the blade chord line (see Fig. 2B). These are measured while blades are locked.
Unsteady pressure sensors (Kulites): Four additional blades have piezoelectric sensors at similar positions – typically at 50% blade height. Two blades serve as redundant channels to ensure repeatability. These are active during blade motion (Figs. 2D, 2E).
Due to limited space inside the blades, pressure and suction sides are measured on separate, adjacent blades. This way, we reconstruct a full 2D pressure distribution around the blade profile – typically from 20 measurement points per blade.
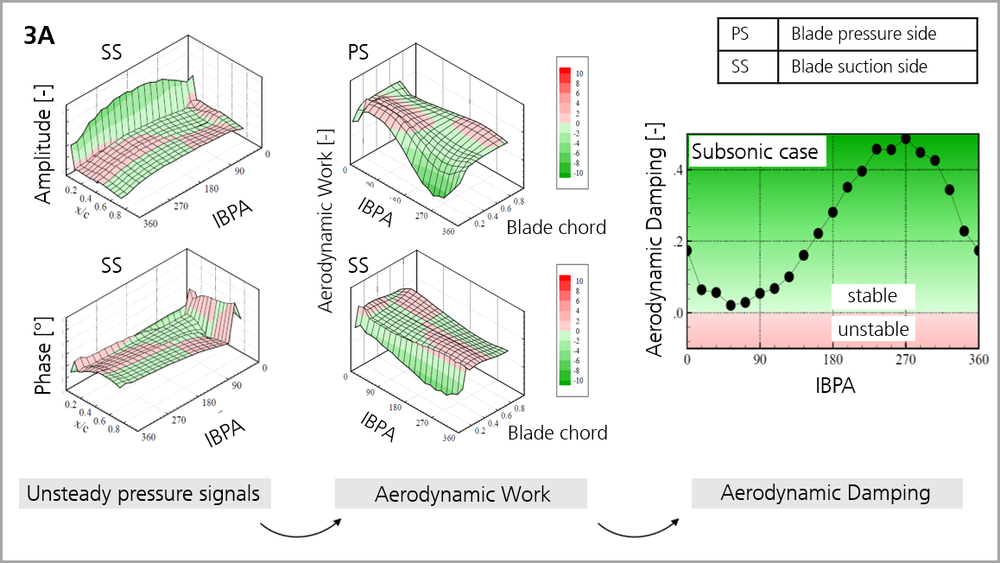
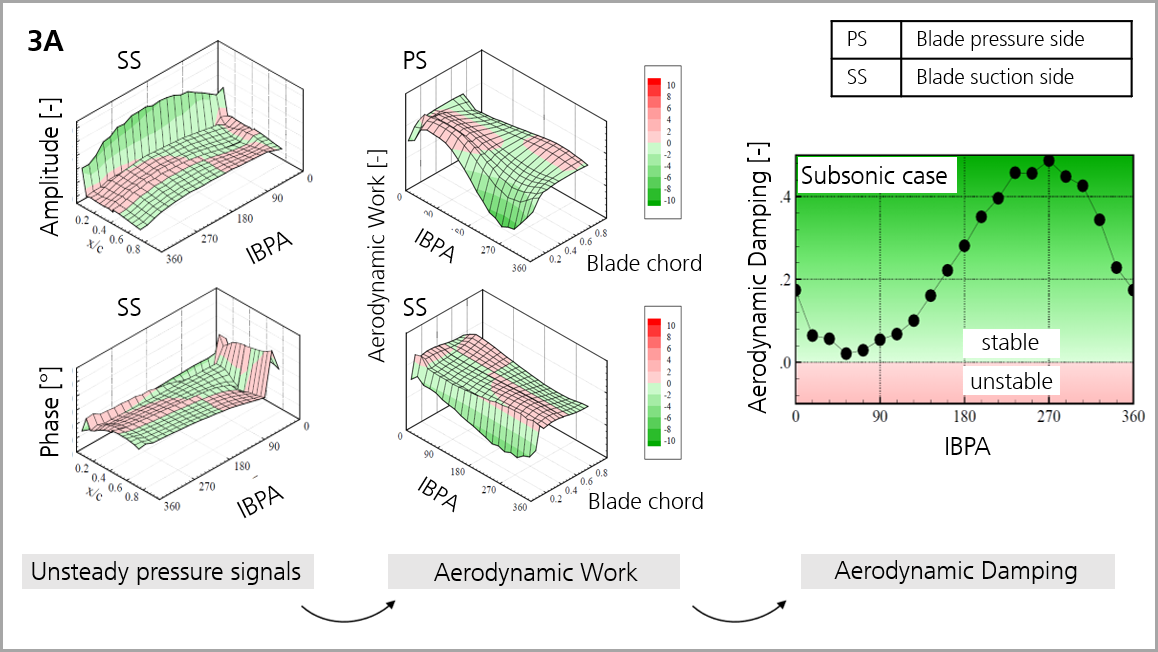
From Signals to Damping: How We Quantify Flutter
The central question of any aeroelastic investigation: Does the blade absorb energy from the flow – or release energy into it?
The phase shift between blade motion and unsteady pressure signal,
Local aerodynamic work on blade pressure and suction sides over one vibration cycle,
Total aerodynamic work, integrated across all measurement points on the blade surface.
From this, we calculate the aerodynamic damping parameter. Interpretation:
Negative total work → Vibration is damped by the flow → positive damping, stable behavior.
Positive total work → Flow amplifies the vibration → negative damping, flutter risk increases.
This analysis is repeated for every IBPA, each flow condition in the measurement matrix, and both vibration modes (1F and 1T). A full measurement campaign typically takes about three weeks.
Figure 3A: Illustration of the evaluation steps to evaluate aerodynamic damping from pressure measurement data across the entire blade surface
High-resolution pressure measurements in space and time,
Repeatable and realistic flow conditions,
makes the Non-Rotating Annular Test Facility (RPG) a vital tool for validating CFD methods, understanding aeroelastic effects – and ultimately, designing more robust compressor and turbine blades.
What’s Next
In the upcoming articles of this series, we’ll show how operating conditions are precisely controlled, present typical results from steady and unsteady measurements, and explain how this data support the design of blades that are more robust against flutter. Stay tuned!


