Detecting oil pollution with a multi-sensor approach
EOC is developing various methods to map oil slicks in both SAR and optical satellite images. The sinking on February 28 of MT Princess Empress, a tanker loaded with 800,000 litres of industrial oil, near the Philippine island of Mindoro is now providing up-to-date research data. Within a month about half of the oil had leaked from the wreck and was dispersed over hundreds of kilometres by the currents.
With the help of satellite data large areas can be monitored and oil spills detected. So far, Synthetic Aperture Radar (SAR) images have been primarily used for this purpose, but films of oil are also visible in optical satellite images. In order to achieve more frequent and reliable tracking of oil slicks, research is under way to make it possible in the future to combine image data from various types of satellites.

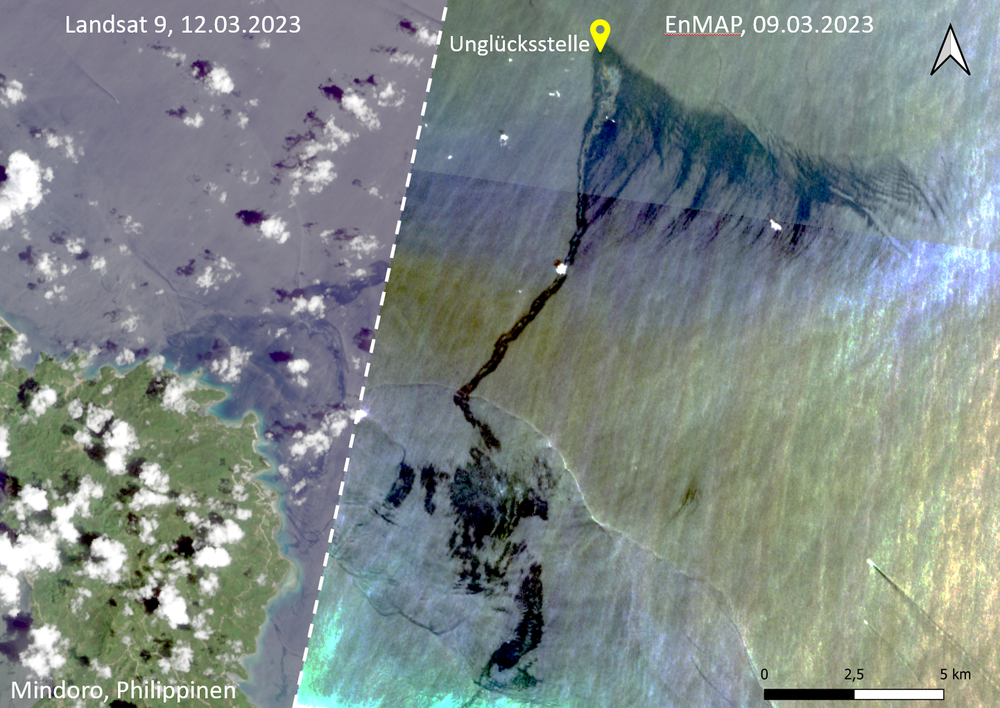
Figure 1: Processed true-colour images from a Landsat-9 recording acquired on March 12 and two EnMAP tiles from March 9, presented as an image mosaic
For the current oil disaster, recordings from the multispectral Landsat satellites and data from the German hyperspectral satellite mission EnMAP (Environmental Mapping Analysis Program) were analysed. The two images show a mosaic composed of details from a Landsat-9 recording of March 12 (at left) and two EnMAP image tiles from March 9 (on the right). The image above shows a mosaic of true-colour images from both satellite recordings, which have been processed to make the oil more readily visible. On the EnMAP recording the approximate position of the sunken ship, and therefore the source of the oil slick (“Unglücksstelle”), can be seen. From that point the oil spread out to the east as well as south toward the coast on March 9. The Landsat recording made three days later shows that the oil had spread further in a westward direction. The ship’s position is outside this Landsat recording; the cut edge of the mosaic matches the edge of the Landsat image.
Because of extremely variable recording and environmentaI conditions, it is difficult to always reliably detect oil slicks in optical images. Different light and wave situations, sensor characteristics, and so-called look-alikes or different surfaces that appear to be similar hinder the usefulness of the customary procedures for all cases. Therefore, the team at the EOC Maritime Safety and Security Lab in Neustrelitz also relies on machine learning and artificial intelligence (AI) methods in addition to developing threshold value approaches. The goal is to automate these methodologies in the future and to employ them around the clock for monitoring tasks, for example as part of the service provided to the European Maritime Safety Agency (EMSA).

Figure 2: Processed true-colour images from the Landsat-9 recording of March 12 and two EnMAP tiles from March 9, augmented by the results of the various oil detection methodologies
The mapping in Figure 2 shows on the left side of the image that the threshold-value approach did not completely reveal the oil surface in the multispectral Landsat image (the violet areas), while the AI method (Deep Neural Network, DNN) overestimated it and also falsely identified some of the cloud shadows as oil (yellow areas). Those places designated as oil by both approaches can however with high probability be assumed to be an oil slick. Successive research will therefore involve combining the two methods.
The hyperspectral data from EnMAP (right side of the image) reveal very good detection of the oil spill (red areas). EnMAP with its 230 channels offers much higher spectral resolution than is possible with the Landsat satellite and supplies signatures that, like a spectral fingerprint, suggest what could be on the Earth surface and could also later permit identification of the danger zone. For the preliminary results shown here, an unsupervised classification using the full 230 channel spectrum was employed.
