Burn Scar Monitoring for Europe: New Products available in EOC’s Geoservice
Forest fires play a crucial role for ecosystems worldwide. In some cases they also directly threaten human life or property and contribute to global change by emitting greenhouse gases. According to a February 2022 report of the United Nations Environment Programme (UNEP), dry and increasingly warm summers are leading to the intensification of forest fires. Timely monitoring of these events is decisive for efficient risk management and the implementation of appropriate countermeasures. In addition, access to high-quality time series is important for analysing trends and addressing ecological challenges. Although monitoring forest fires using thermal information from satellite data has been the customary practice for decades, so far there has not been an automatically generated, continent-wide burn scar product available in near-real time. There are various reasons for this that are primarily due to cloud cover, smoke formation, and also the misclassification of shadows and snow surfaces. Therefore, it is customary to consult time series that contain satellite data recorded over several months after a fire, so information about burnt areas can be provided for evaluation only after a delay.
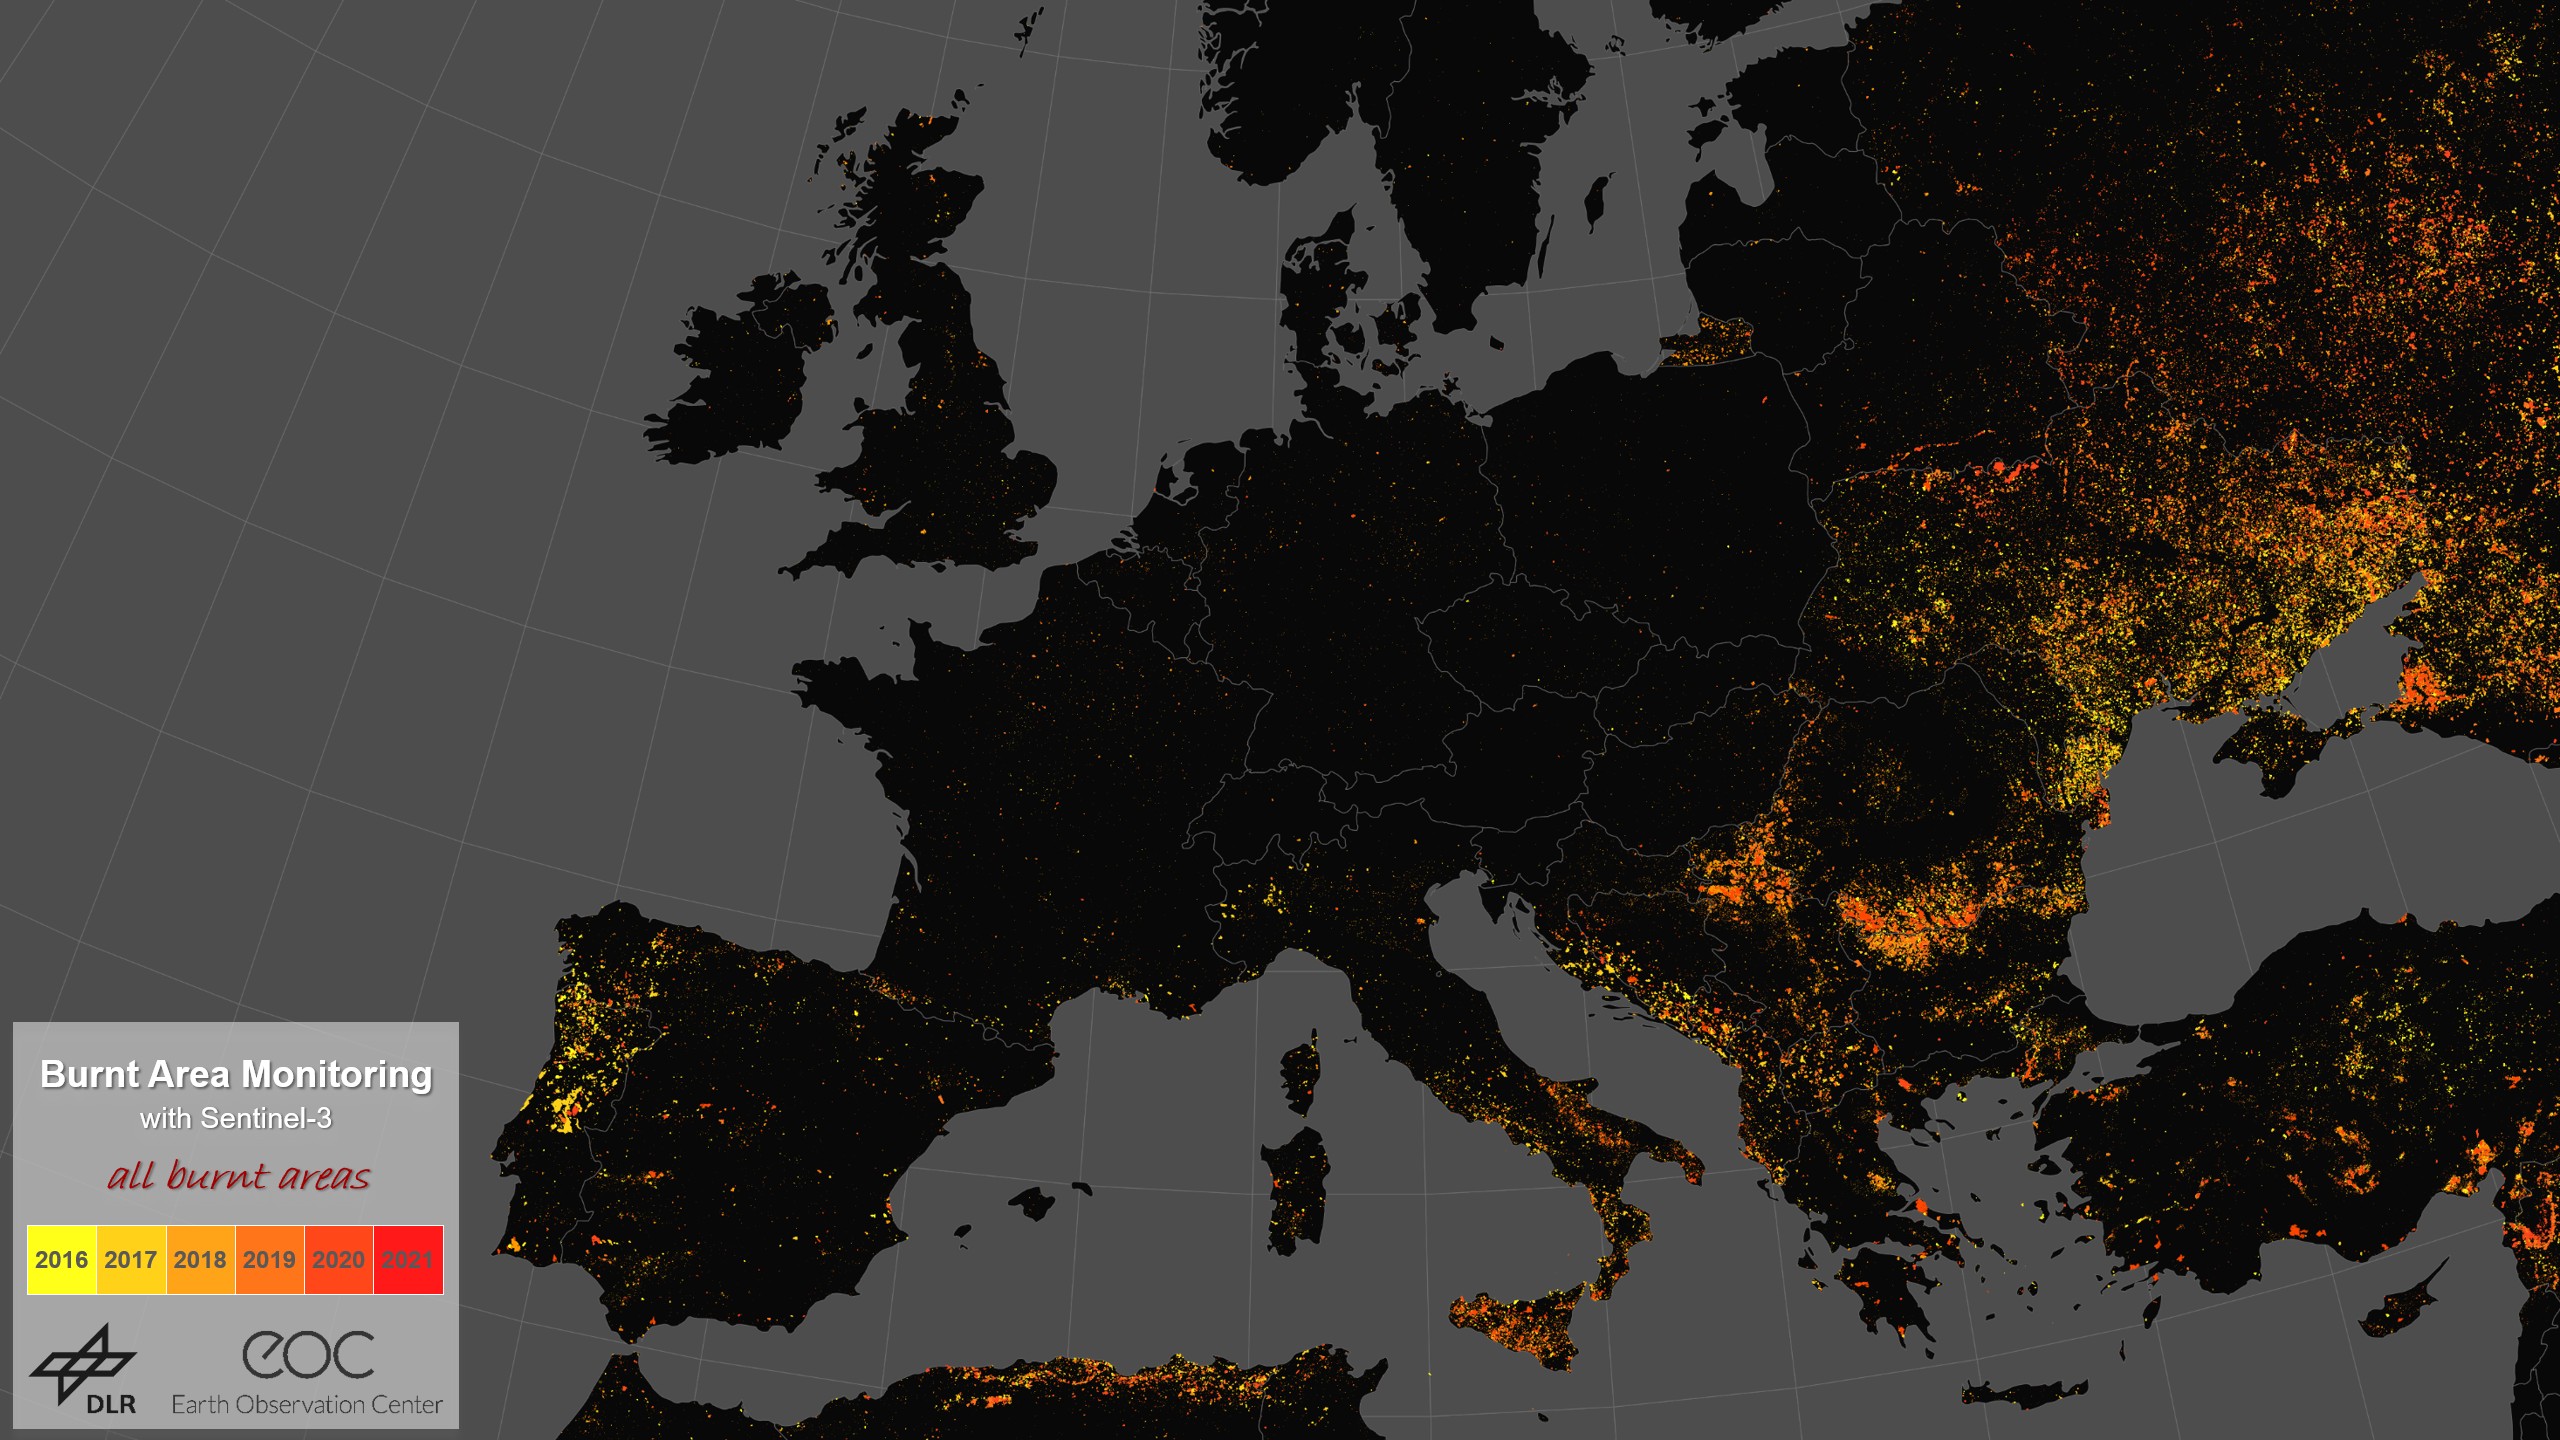
For making urgent decisions relating to disaster management, receiving information in near-real time is however essential. The dataset introduced here is based on a fully automated approach and shows the extent of burnt areas within one to two hours after the Sentinel-3 Copernicus satellite scene has been recorded. In addition, attribute information about the seriousness of the burn and the precise time of detection is included in the data. It is also possible to precisely observe the evolution of each individual fire site. The data product is iteratively updated repeatedly over a ten-day period as soon as new satellite data are available. This makes it possible to continuously improve the accuracy of the surfaces derived by minimising the influence of disturbances like cloud cover. In addition to the daily-updated data product (“Daily Product”), the results are also collated into monthly and annual composites (“Monthly Product” and “Yearly Product”) and made available. While the information in the daily product is always accessible for the prior 50 days, the archived monthly products are to be had already from April 2016, and the first yearly product from 2017. This time series makes it possible to derive large-scale changes in the size of affected areas and their severity. By the end of 2021 a total of some 100,000 satellite scenes from the (Ocean and Land Colour Instrument (OLCI) sensor on the Copernicus Sentinel-3 A/B satellites had been used in the processing.
The data are available from the Geoservice of DLR’s Earth Observation Center (EOC) and make possible both an immediate overview of the current situation as well as time series analyses. Using Web Map and Web Feature Services (WMS/WFS) the data can readily be integrated into existing projects and applications, or downloaded. The methodology for the derivation of the fire scars has been published in a science journal, as has an analysis of the major fires on the east coast of Australia in 2019/20 based on this methodology (see links at right).
Links


