
Comparison of two aircraft designs using different climate metrics

Comparison of two aircraft designs using different climate metrics
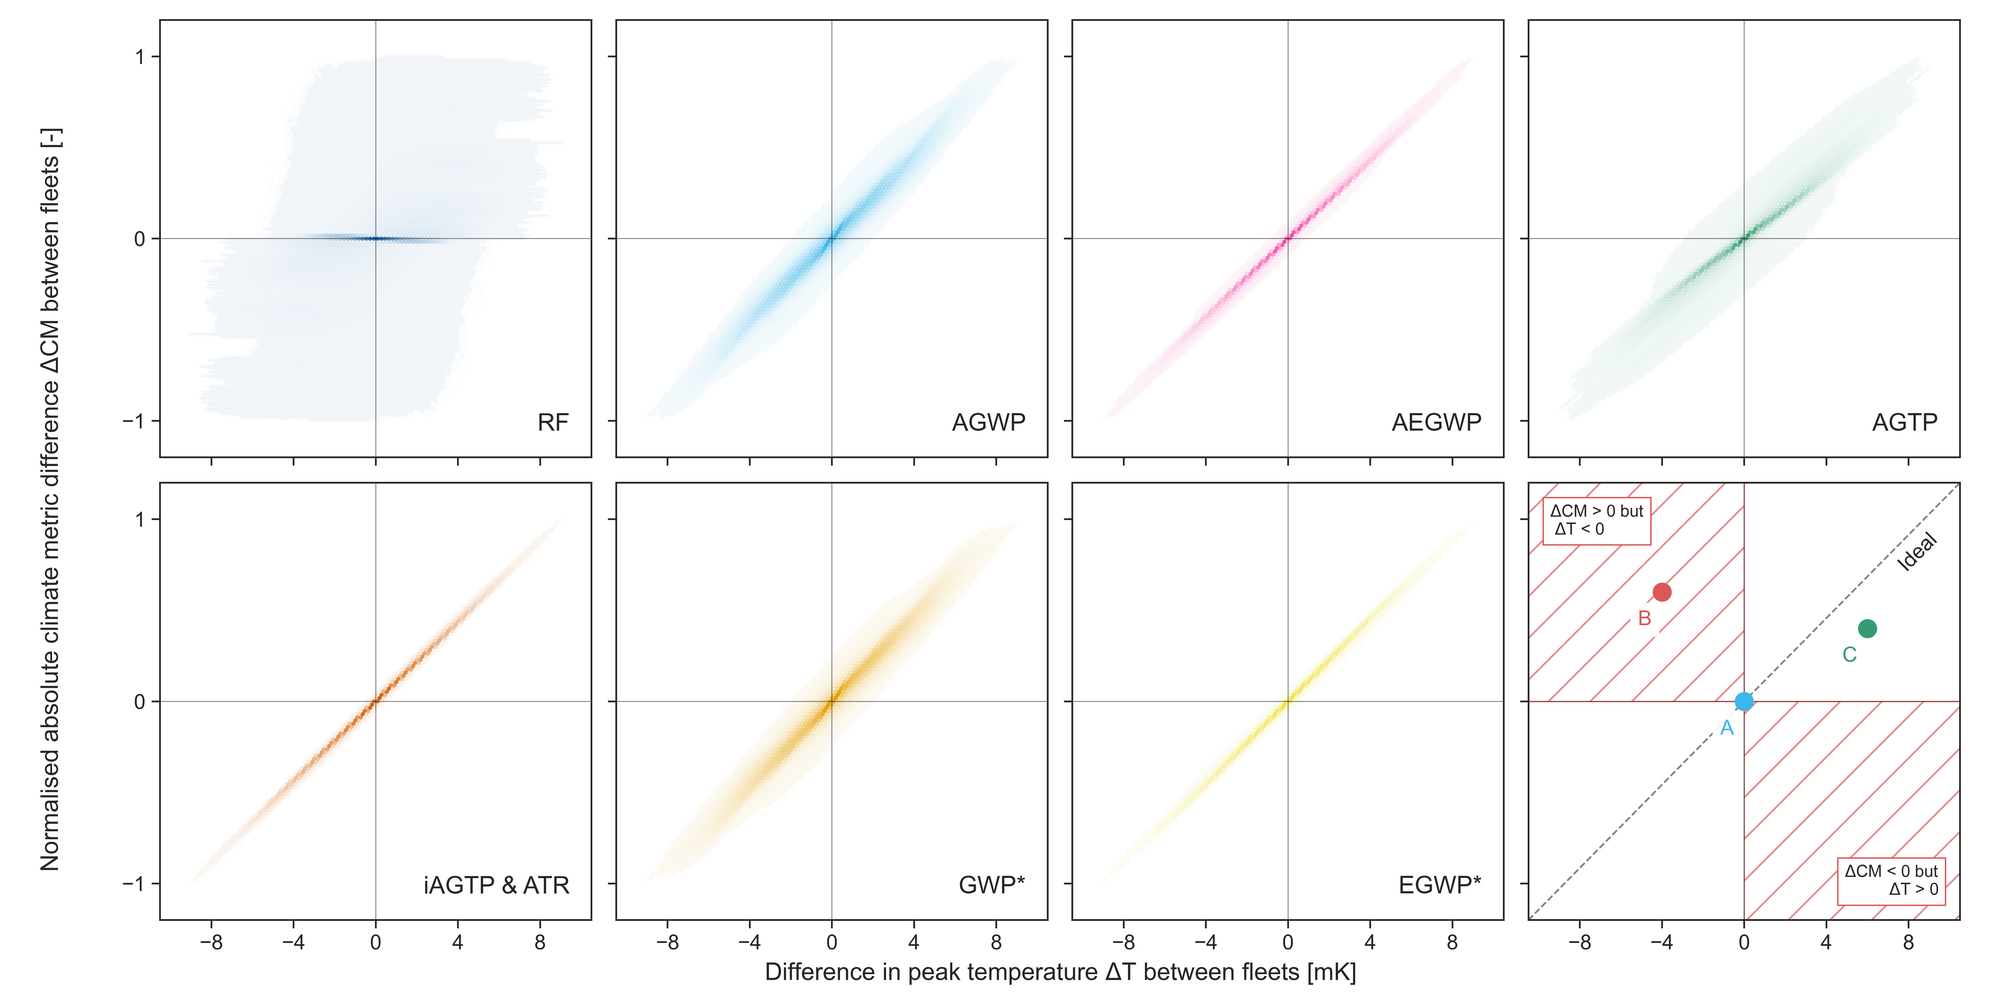
Pairwise comparison of any two aircraft designs using different climate metrics with 100-year time horizons. An example aircraft pairing is shown in the bottom-right panel: Neutrality is shown for the pairing of aircraft A and aircraft C but not for pairing A-B, since the climate metric value is higher but peak temperature is lower. An ideal climate metric would show results a diagonal line through the bottom-left to top-right quadrants. The EGWP* is the most neutral climate metric, but is found not to be compatible with existing climate policy. The ATR and EGWP perform best across all analyses.