
graFMECA
graFMECA is a tool to represent and exploit the content of FMECA (Failure mode, effect and criticality analysis) tables.
When an FMECA table exists in csv form, this tool can visualize it in a neat way. Connections between component functions, failure modes, failure causes, failure detection methods and failure compensation provisions are displayed so that the user is not overwhelmed by the mass of information.
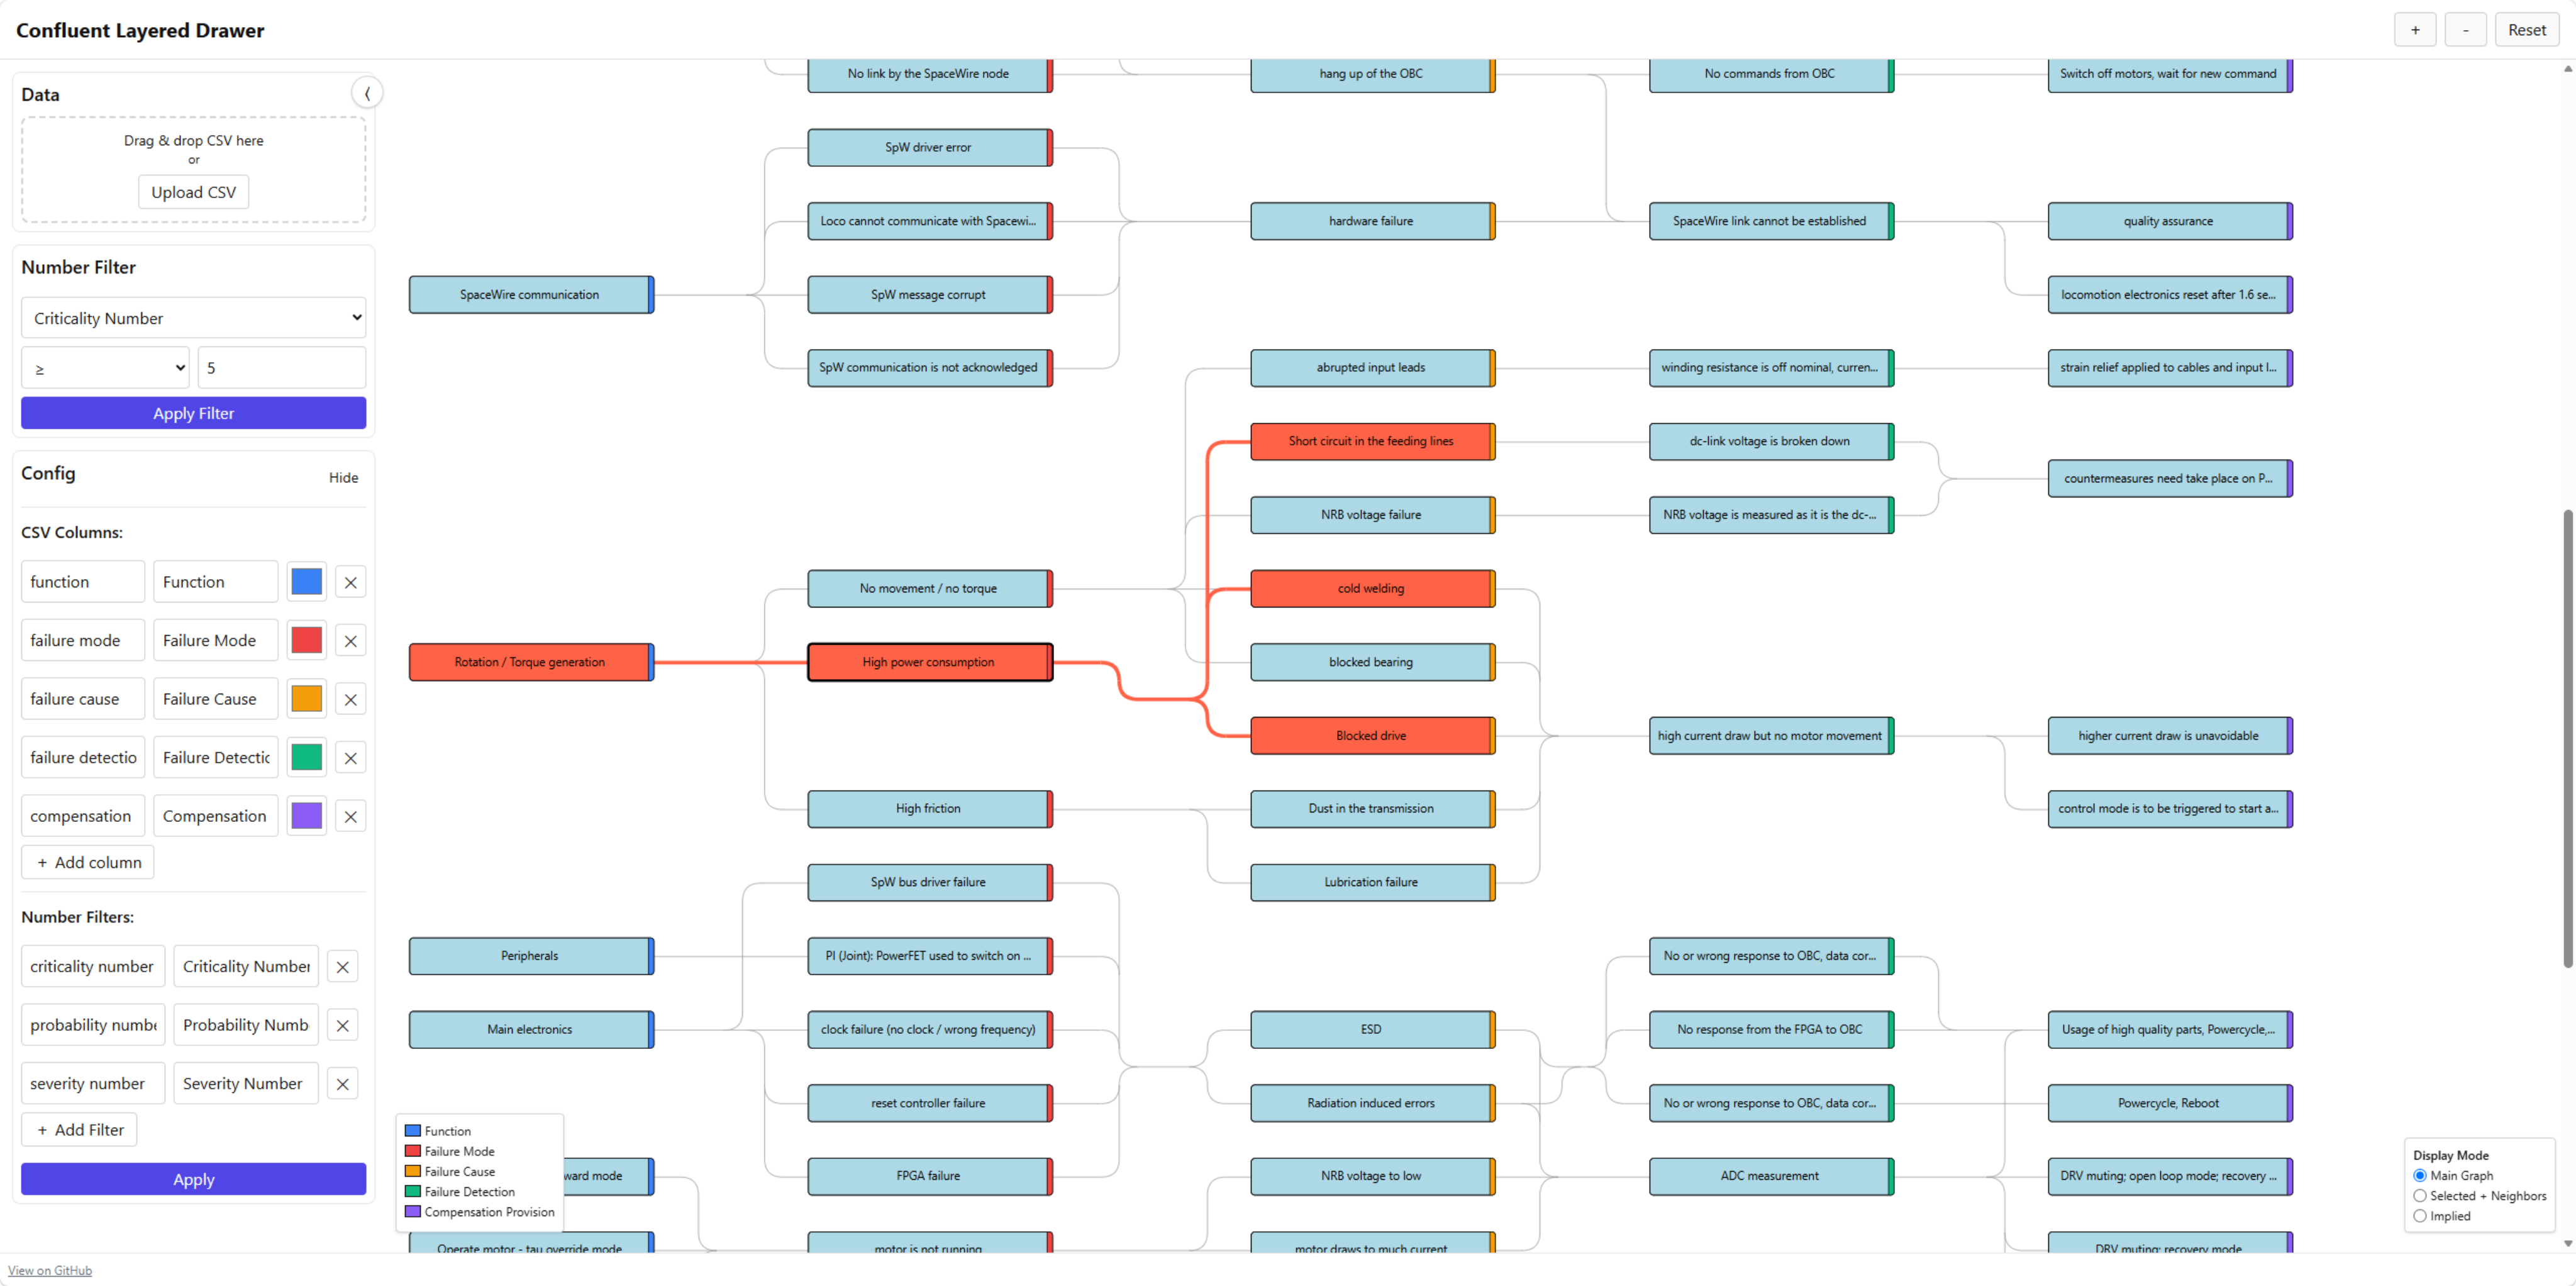
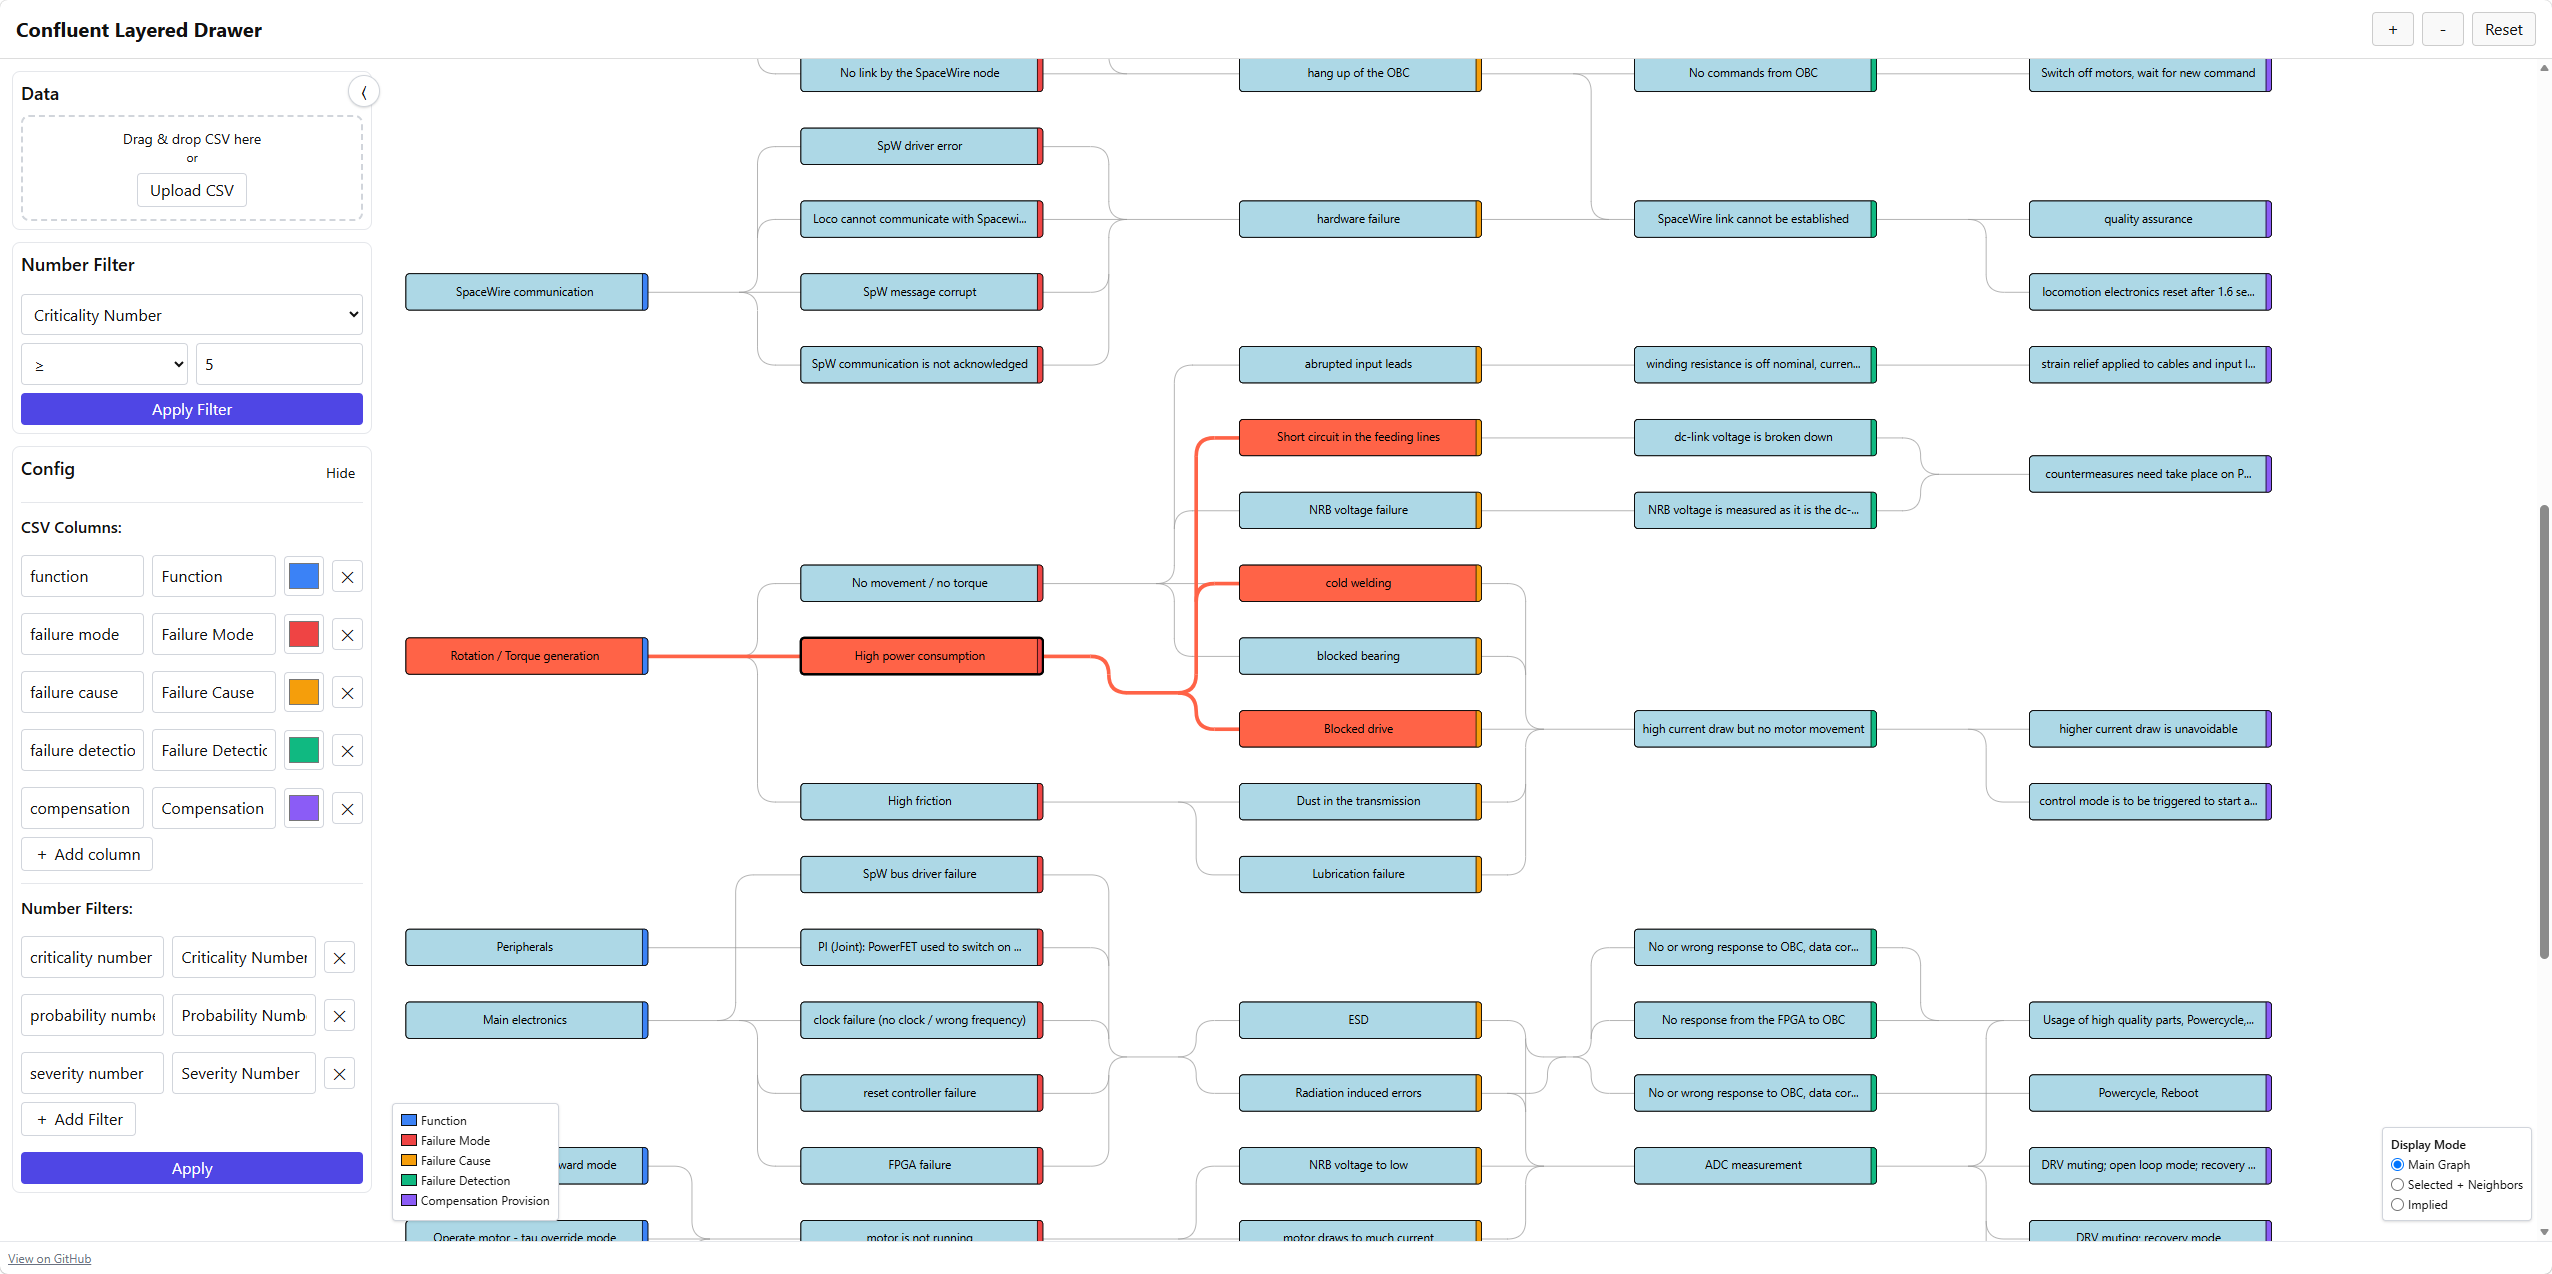
Failure mode, effect (and criticality) analysis is important for every critical system. Its outcome is often represented by a huge Excel table. It can be difficult to keep the overview and detect defects like similar detection methods for different fault sources or circular reasoning of fault sources. Further, engineers implementing fault detection methods might want to filter the results. Therefore, we developed graFMECA, a tool to represent the FMECA in a graphical way with clear and unambiguous edges and additional features that help to use the FMECA.
Features
- Interactive Selection: Single nodes can be selected, and the corresponding connections are highlighted. Also, multiple nodes can be selected simultaneously.
- Dynamic Filtering: The graph can be filtered to display subgraphs, either to see only the connections to the currently selected node(s) or to display only the subgraph which is connected with a certain criticality (probability, severity) number.
- Flexible Data Handling: CSV column names can be individually renamed; columns can be added or removed to match project-specific requirements.
Implementation
graFMECA is implemented as a browser-based application using TypeScript, Node.js, and Vite. All computations run locally in the browser, ensuring that FMECA data remains on the user’s device.
The graph is rendered in SVG for precise scaling and interactive inspection, with D3.js supporting dynamic updates and user interaction.