DLR has calculated the displacements caused by the earthquake using satellite data

DLR has calculated the displacements caused by the earthquake using satellite data
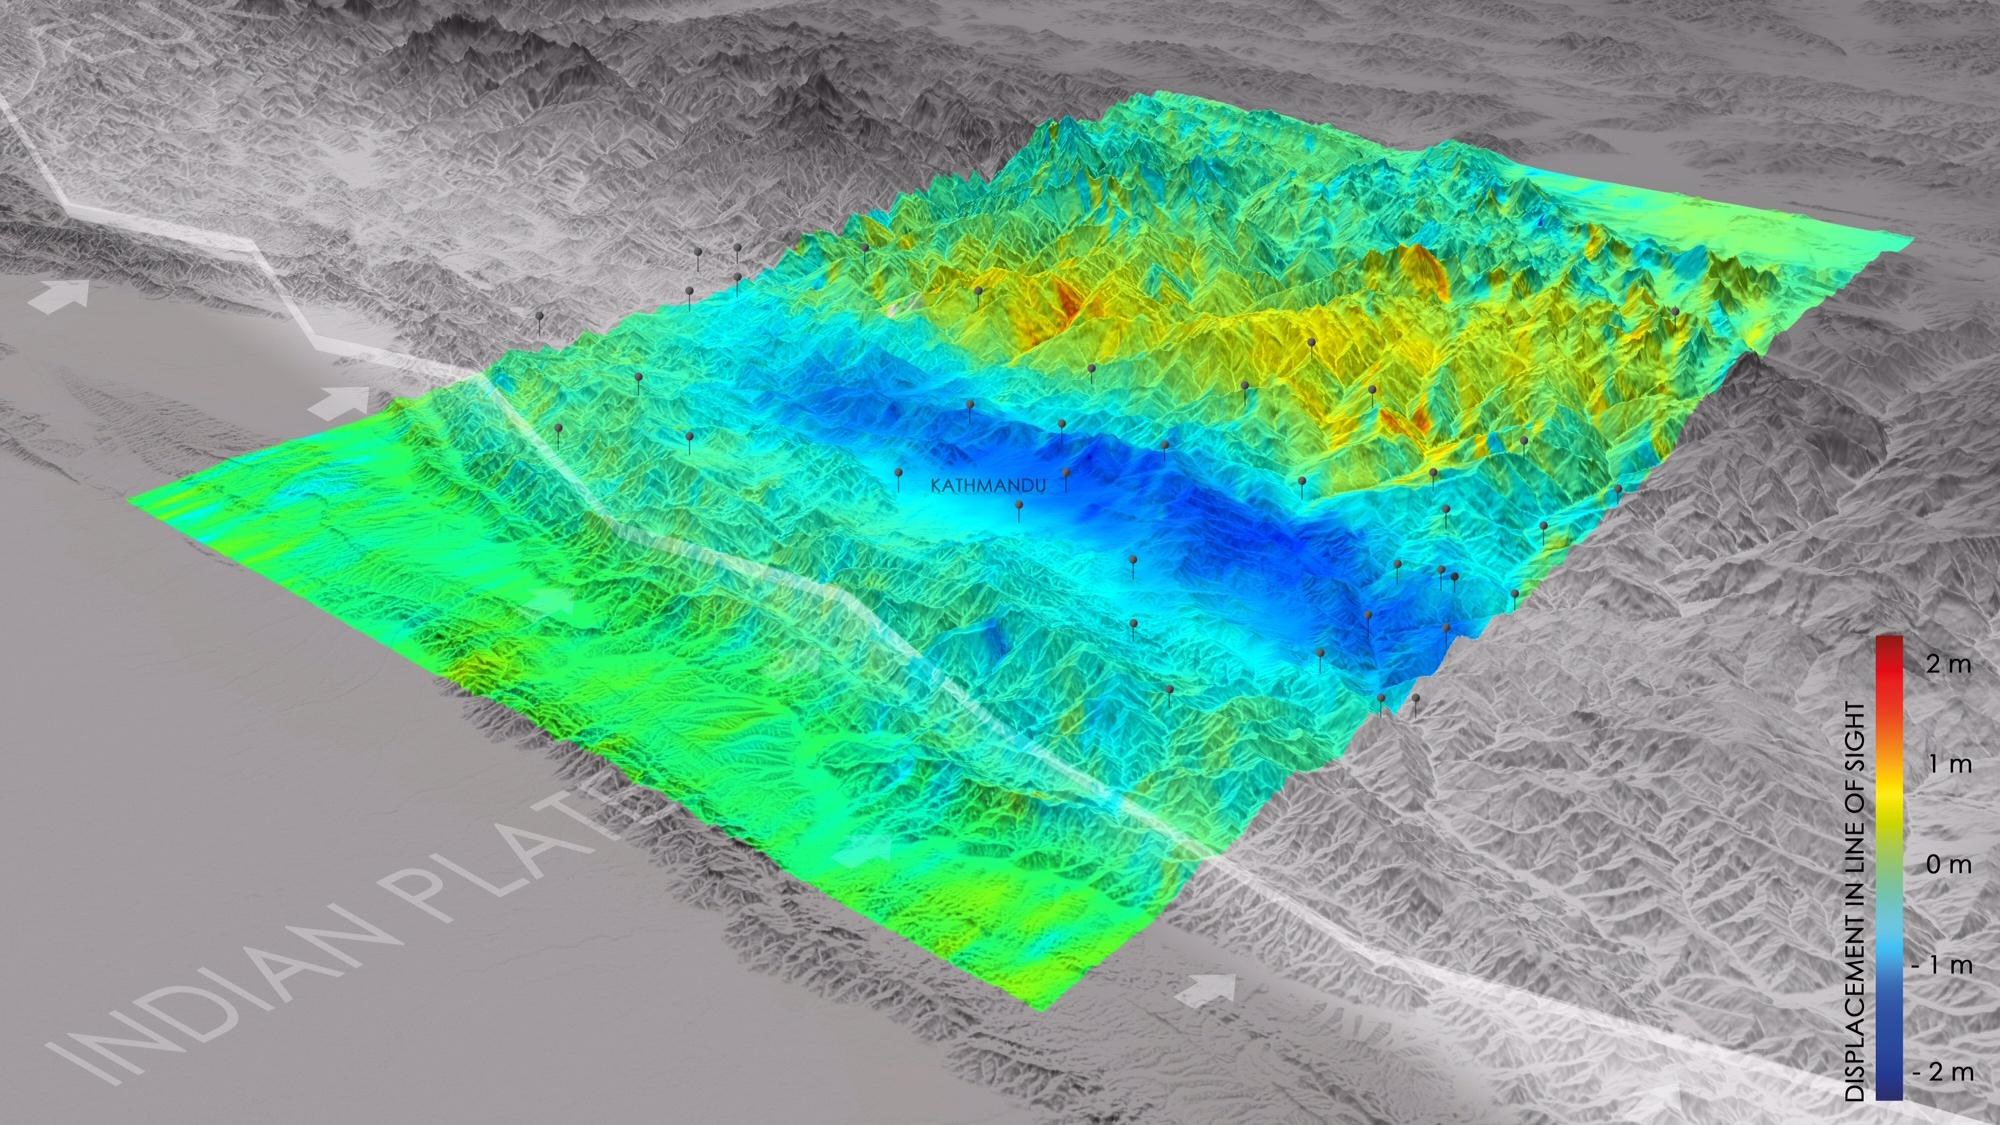
This image shows the changes in elevation and position that occurred in the direction of the satellite between data acquisitions before and after the earthquake. Tensions building up between the Indian and Eurasian tectonic plates were released by the earthquake and produced sudden ground movements. The resulting deformations are colour-coded. Near the plate boundary, the ground was moving towards the satellite, that is upwards (blue area); further to the north there was related subsidence (red and yellow), a counter-movement that often occurs during earthquakes in subduction zones. In addition, DLR researchers detected a strong horizontal movement of up to two metres in a north-south direction. In the image, the locations of numerous aftershocks in recent days are also displayed.