Changes in global surface temperature

Changes in global surface temperature
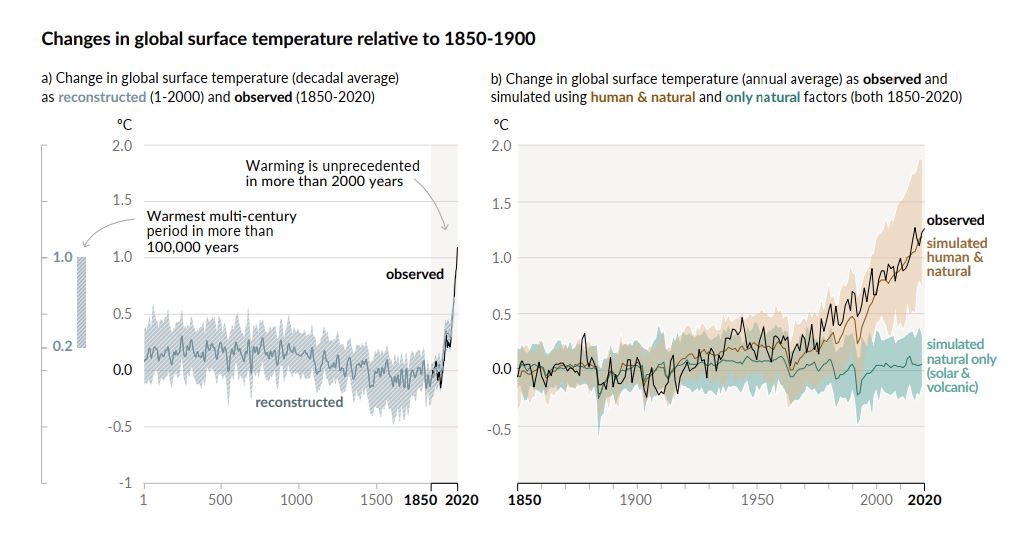
The rate at which global surface temperature has warmed due to human activity is unprecedented in at least the last 2000 years of Earth’s history. The left-hand graph shows temperature changes over the past 2000 years. The dark gray line denotes values reconstructed using paleoclimatic archives from year one to year 2000. The black line shows the observed warming from 1850 to 2020. The values are decade-averaged and relative to 1850-1900. The graph on the right shows observed temperature changes over the last 170 years – compared to climate model calculations. The measured data (black line) are annual averages, relative to the years 1850-1900. The colored areas show the results of the CMIP6 climate model simulations. The light brown areas show the calculated warming due to human causes and natural factors. This climate simulation agrees well with scientific observations. The green areas show how the global surface temperature would have evolved if only natural causes were considered, such as solar or volcanic activity. The comparison of the simulations and observations clearly shows that humans are mainly responsible for the warming of the climate system.