Satellite observations combined with climate chemistry models

Satellite observations combined with climate chemistry models
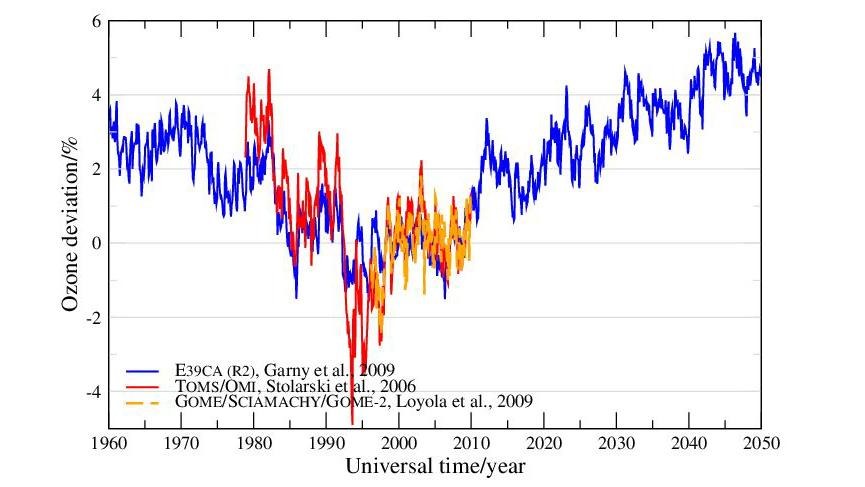
Anomalies in the global levels of ozone – orange and red lines represent satellite observations; the blue line shows the results of a digital simulation with a DLR climate chemistry model. The ozone layer reached its lowest levels in the nineties and has been recovering ever since.