Winter wheat yield map

Winter wheat yield map
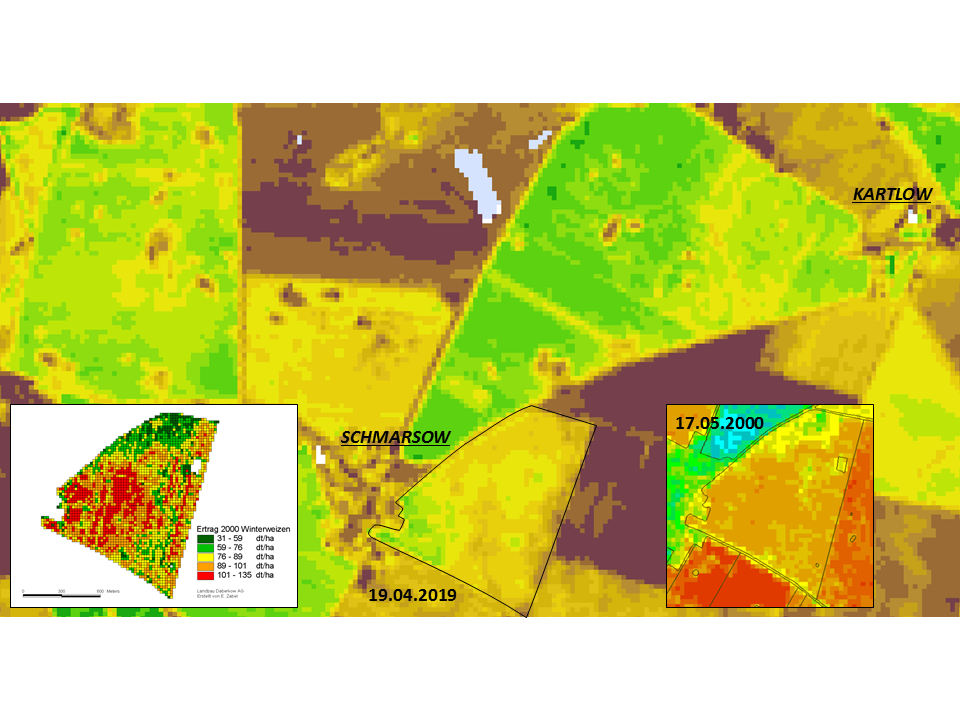
Even with a pixel resolution of 30 metres by 30 metres, a differentiation within the field can be demonstrated, which may indicate different management requirements. The in-field differences, which can be detected by satellite remote sensing, may be reflected in the yield data. The yield map of winter wheat from the year 2000 (left, with permission of Daberkower Landhof AG, created by Edgar Zabel) can be visually correlated with the in-field differentiation visible in the Landsat 5 TM scene from 17 May 2000. In the background, a Landsat 8 OLI scene from 19 April 2019 can be seen. It shows a similar appearance. Both scenes show the Normalised Difference Vegetation Index (NDVI) as a simple indicator of biomass activity at the time of acquisition.