Development of nitrogen dioxide pollution over Lombardy

Development of nitrogen dioxide pollution over Lombardy
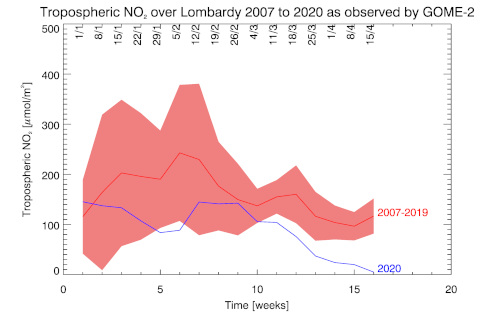
Temporal evolution of the nitrogen dioxide load over Lombardy from 1 January to 15 April, as derived from satellite observations (GOME-2 on board the MetOP-A satellite). Shown are tropospheric vertical columns in µmol/m², i.e. number of nitrogen dioxide molecules per square metre. The blue curve shows the course for the year 2020. The red curve shows the average value for the same period over the years from 2007 to 2019. The light red area indicates the variability (standard deviation) over this period. From the beginning of March, at the same time as the lockdown in Italy, the blue curve is below the fluctuation range of the long-term comparative measurements.