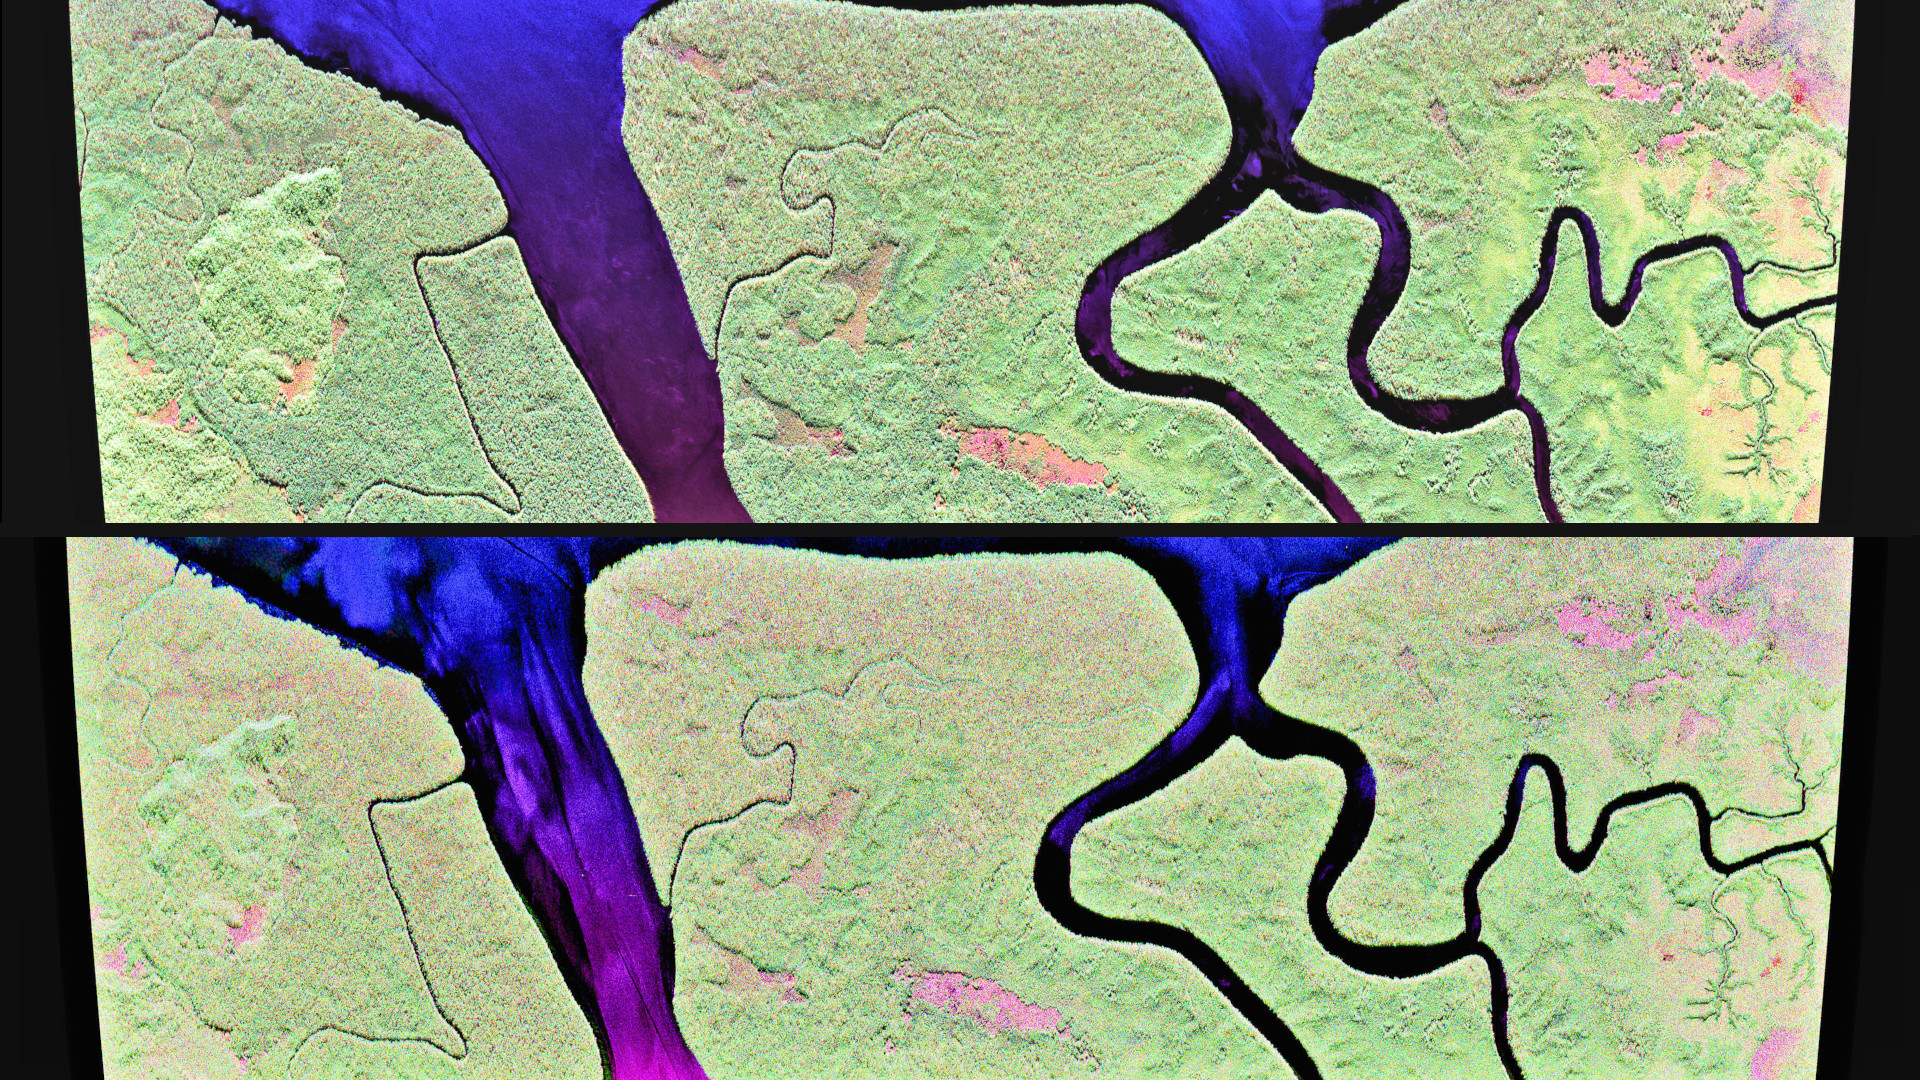
The 'Pongara' test area imaged by the F-SAR radar sensor in L-band (upper image) and in P-band (lower image)

The 'Pongara' test area imaged by the F-SAR radar sensor in L-band (upper image) and in P-band (lower image)
This area is mainly covered by very high mangrove forest and tropical swamp forest. The area, with its very abundant wildlife, is designated as a national park. L-band (23-centimetre wavelength), with its shorter waves, is scattered to a greater extent several times in the crowns of the trees, which is responsible for the greater amount of green in the upper image. The longer-wave P-band (70-centimetre wavelength), on the other hand, penetrates more strongly through the canopy and is reflected to a greater extent by the underlying surface and the tree trunks, so that the green component in the lower image is less, particularly in the area of the mangrove forest.