Elevation models from SRTM now available for download free of charge


Elevation models from SRTM now available for download free of charge
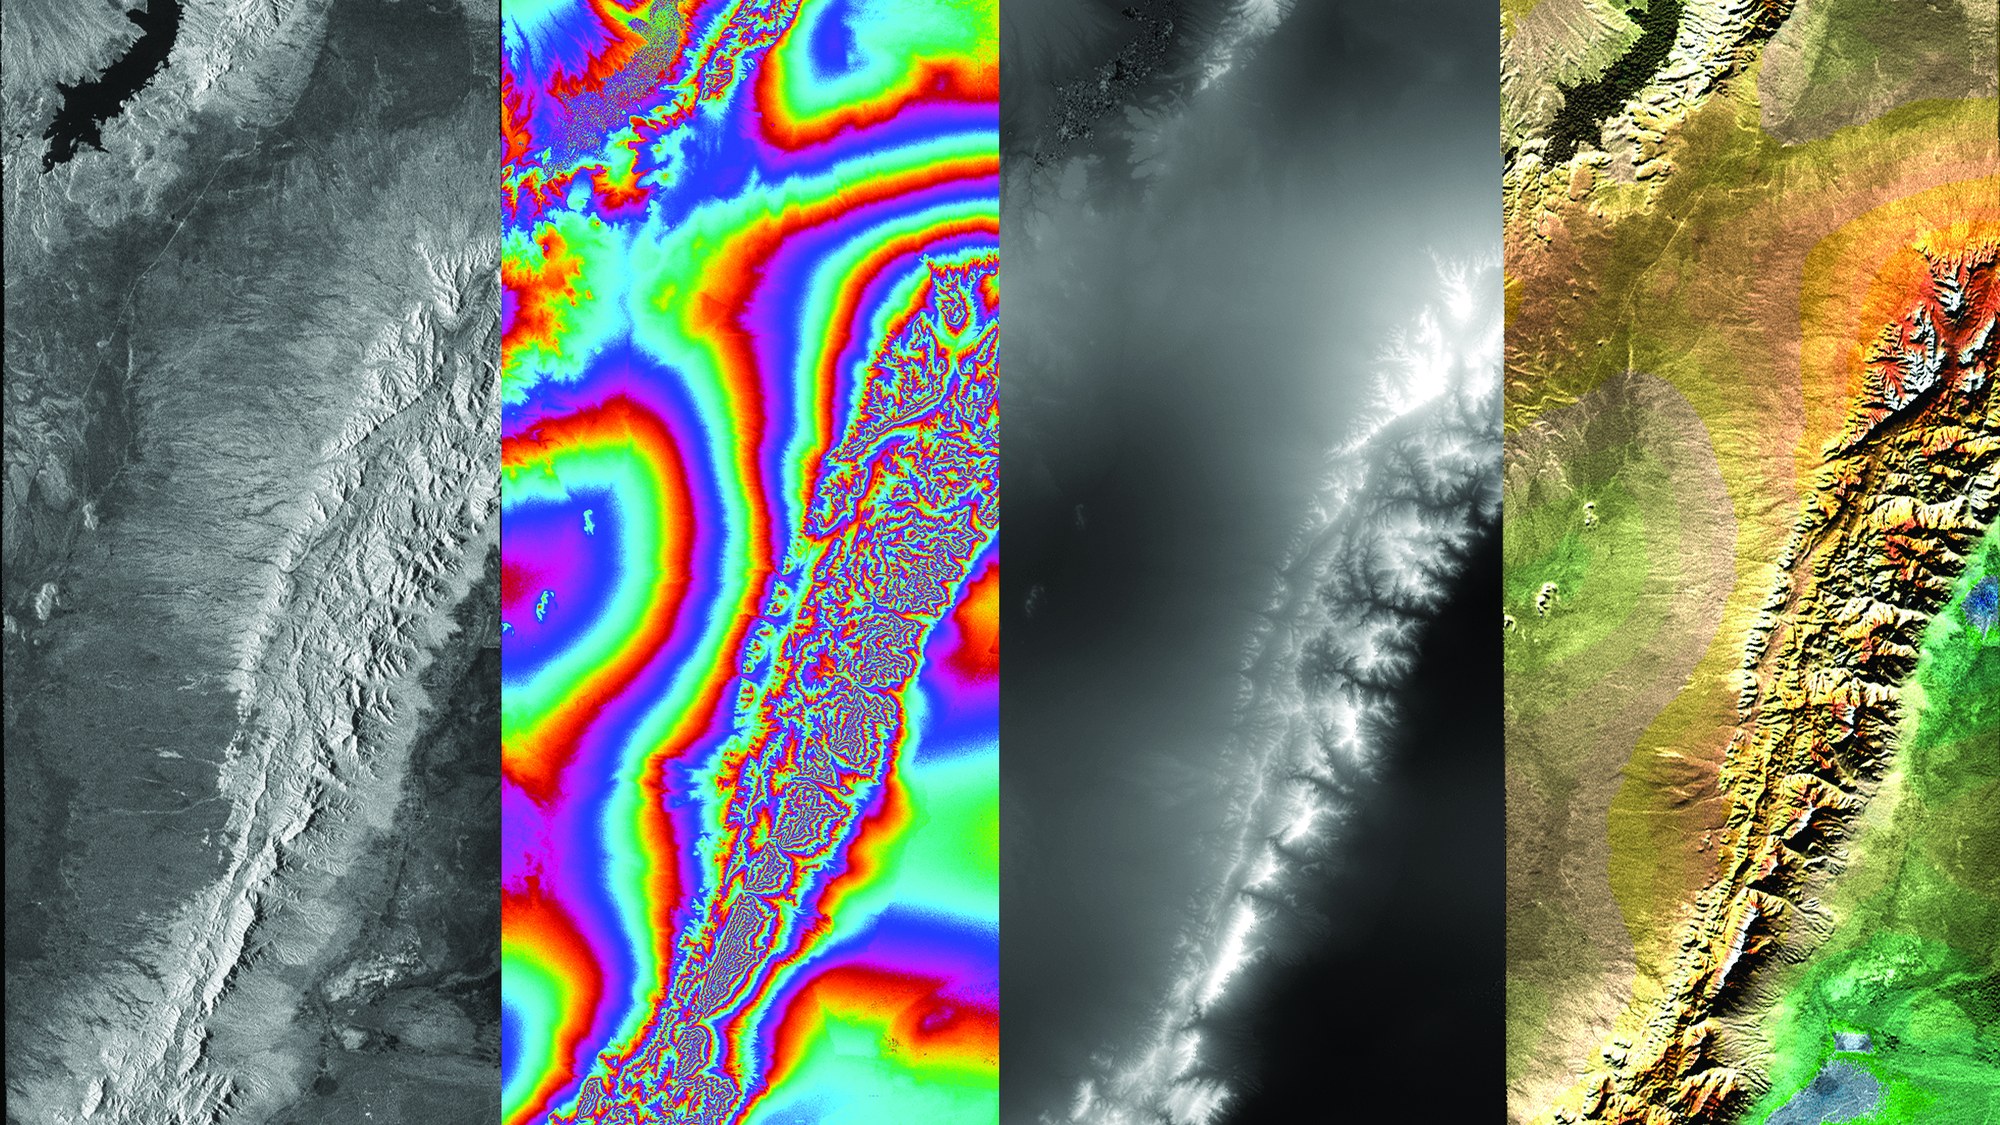
Based on two radar images as provided by SRTM (one of the two images can be seen on the far left of the figure), the first intermediate step is to calculate their differences. These differences in the phase information are shown in the second image (from the left) as so-called fringes. The height model (third image) can be derived from this. Low-lying regions are shown in dark grey, higher areas in light grey. Each grey value represents an altitude value in metres above sea level. Finally, the last image in the sequence shows the shaded digital elevation model coloured in atlas colours. In order to increase its interpretability, the radar image was included in the colouring.