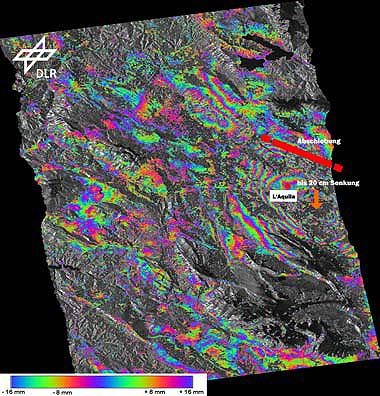
The Italian town of L'Aquila after the 6 April 2009 earthquake
The Italian town of L'Aquila after the 6 April 2009 earthquake
The picture from the German TerraSAR-X radar satellite shows the area around the Italian town of L'Aquila after the magnitude 6.3 earthquake which struck on 6 April 2009. Two images from the satellite were combined for the picture into a so-called differential interferogram. For the analysis, two TerraSAR-X images in stripmap mode were used with a resolution of 1.7 x 3.4 metres. The first image was taken on 6 February 2009 and the second on 13 April 2009.
The 'coloured rings' around L'Aquila stand out. These rings represent, in colour coding, the ground movement caused by the earthquake. One colour sequence represents a shift of about 1.6 centimetres; at the centre, there was a maximum subsidence of about 20 centimetres. The movement primarily occurred at the fault located northeast of L'Aquila, marked in red on the picture.

