Mapping flood areas using Sentinel-1 data

Mapping flood areas using Sentinel-1 data
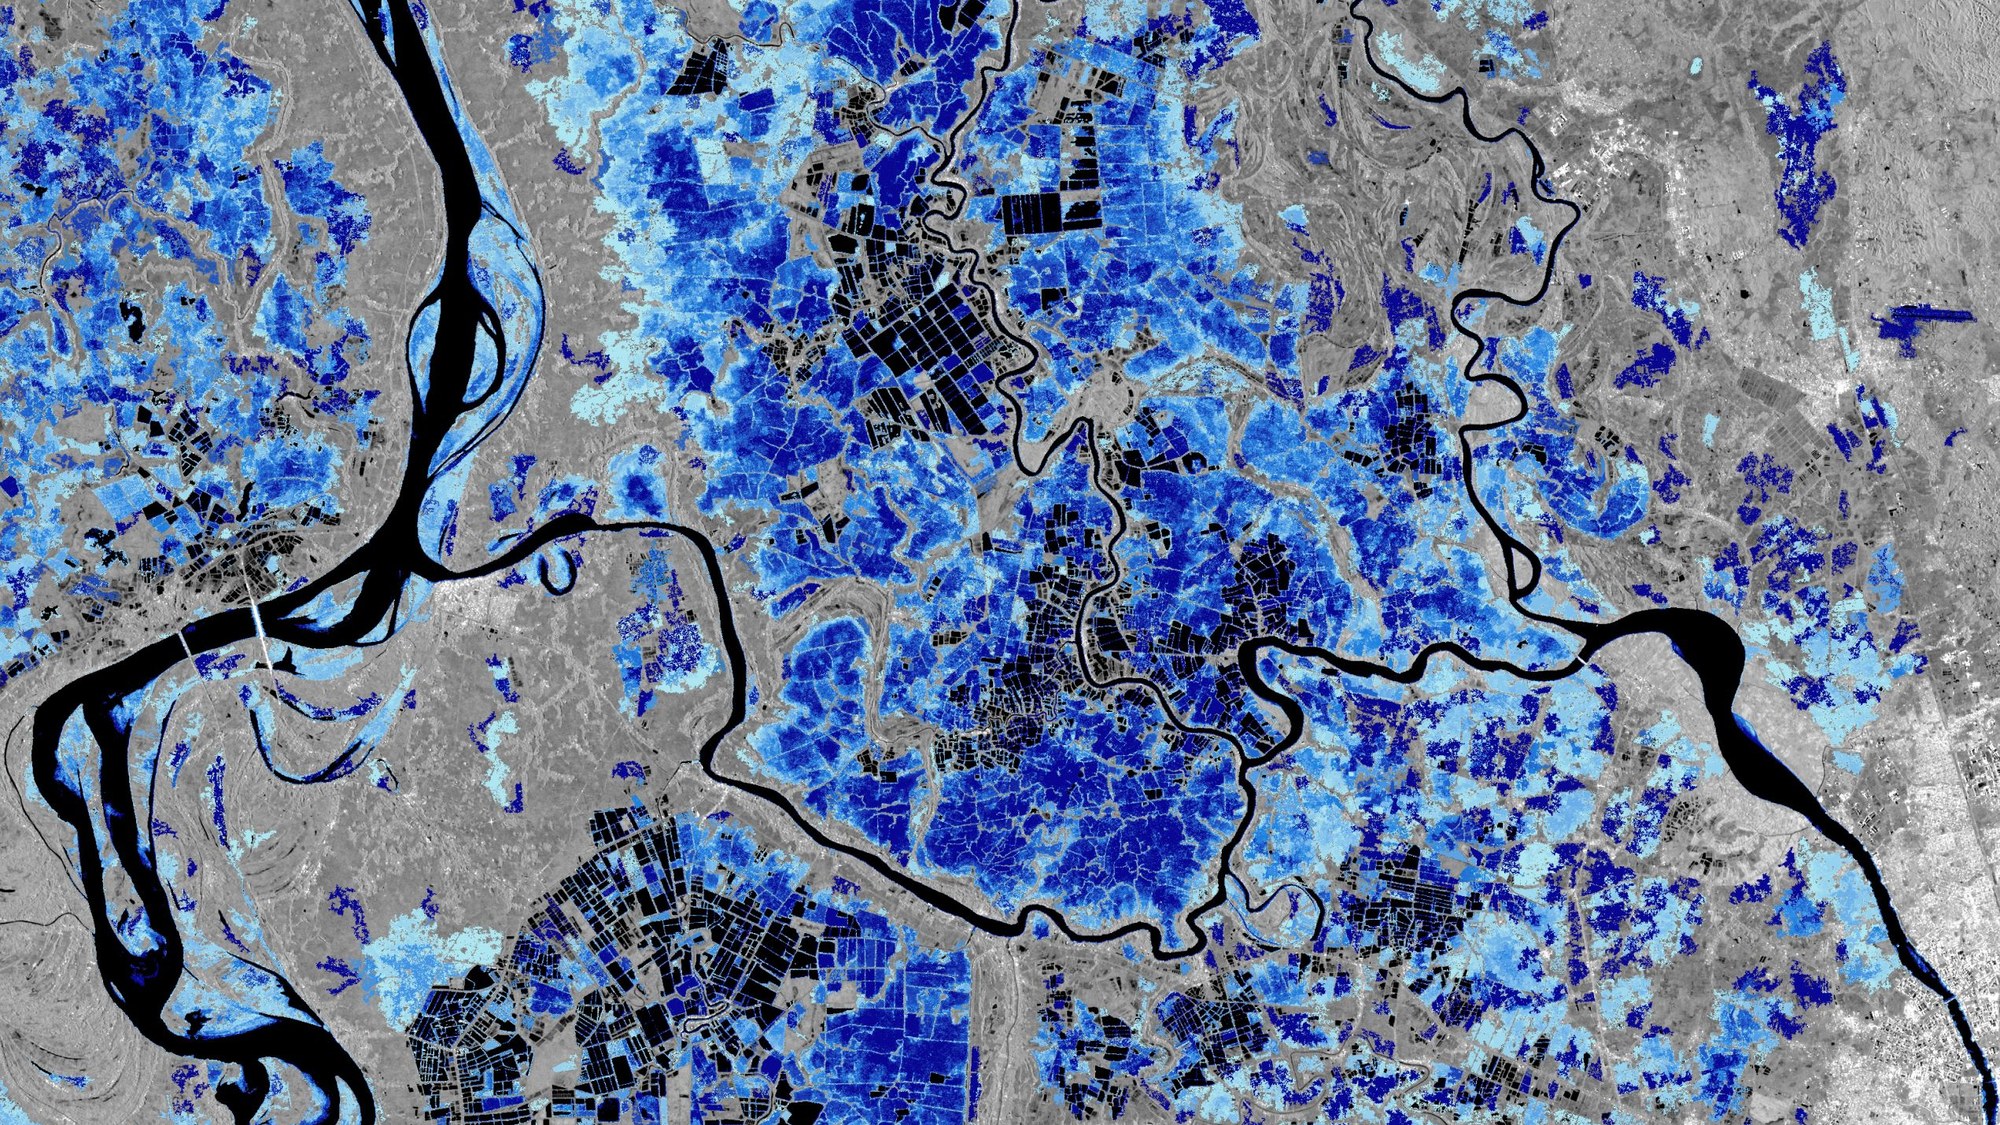
The image shows areas in Myanmar that are frequently affected by flooding. The dark areas represent permanent bodies of water or fields that are regularly or permanently flooded, such as rice paddies. Different shades of blue represent flood frequency, derived from the Copernicus Sentinel-1 data archive; light blue indicates flooding less often, while dark blue shows more frequent flooding.
Credit:
ESA