Radar images of Puch in X, C, S and L bands

Radar images of Puch in X, C, S and L bands
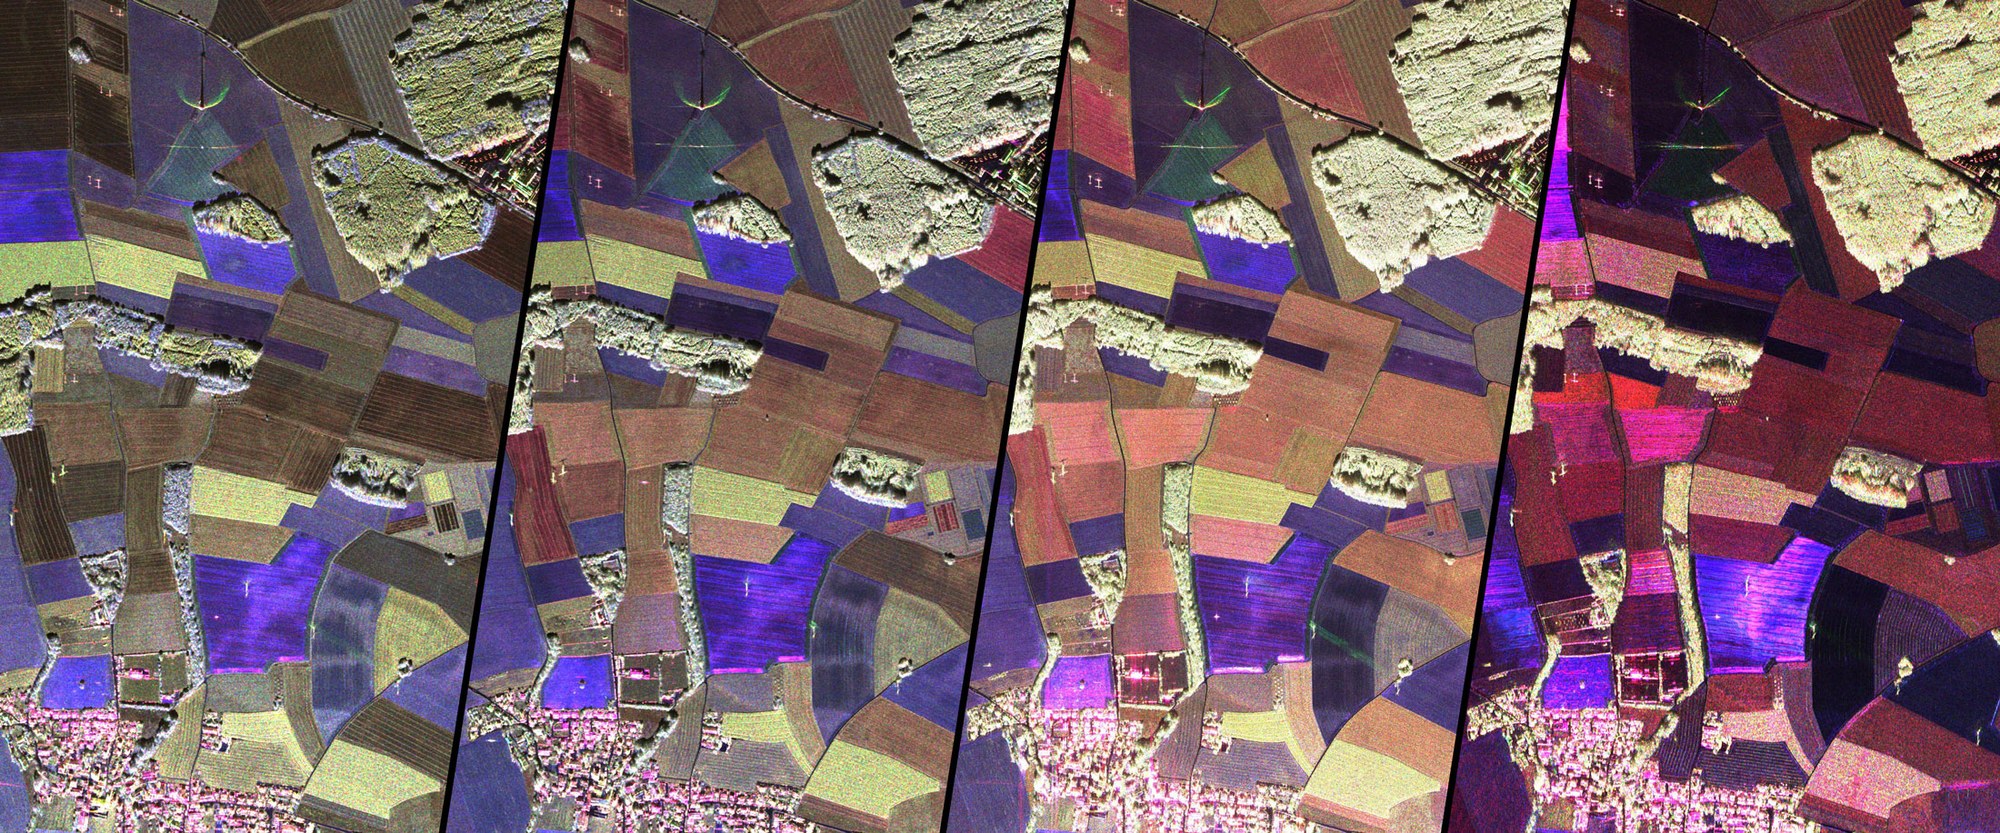
For the CROPEX25 measurement campaign, the DLR team took radar images of the same region in different frequency bands. The Puch test region in Bavaria can be seen here in X, C, S and L bands (left to right) from a flight on 11 May 2025. Radar interacts differently with surface features depending on the wavelength (3 to 24 centimetres). Longer wavelengths penetrate deeper into vegetation, revealing information about the structure of the vegetation and soil beneath.