Passenger transport in Germany – a comparison of transport modes
With its new 'Facts and Figures' series, the German Aerospace Center (Deutsches Zentrum für Luft- und Raumfahrt; German Aerospace Center) provides information on current social issues and challenges. The publications are based on research and analyses carried out by DLR and other research institutions, public authorities and ministries. The findings are presented in the form of graphics and explanatory texts.
Focus: Mobility in Germany
This first instalment in the series examines mobility in Germany, focusing in particular on passenger transport. The emphasis is on the development of transport performance by road, rail and air, as well as the resulting carbon dioxide (CO2) equivalents.
Passenger transport performance in Germany


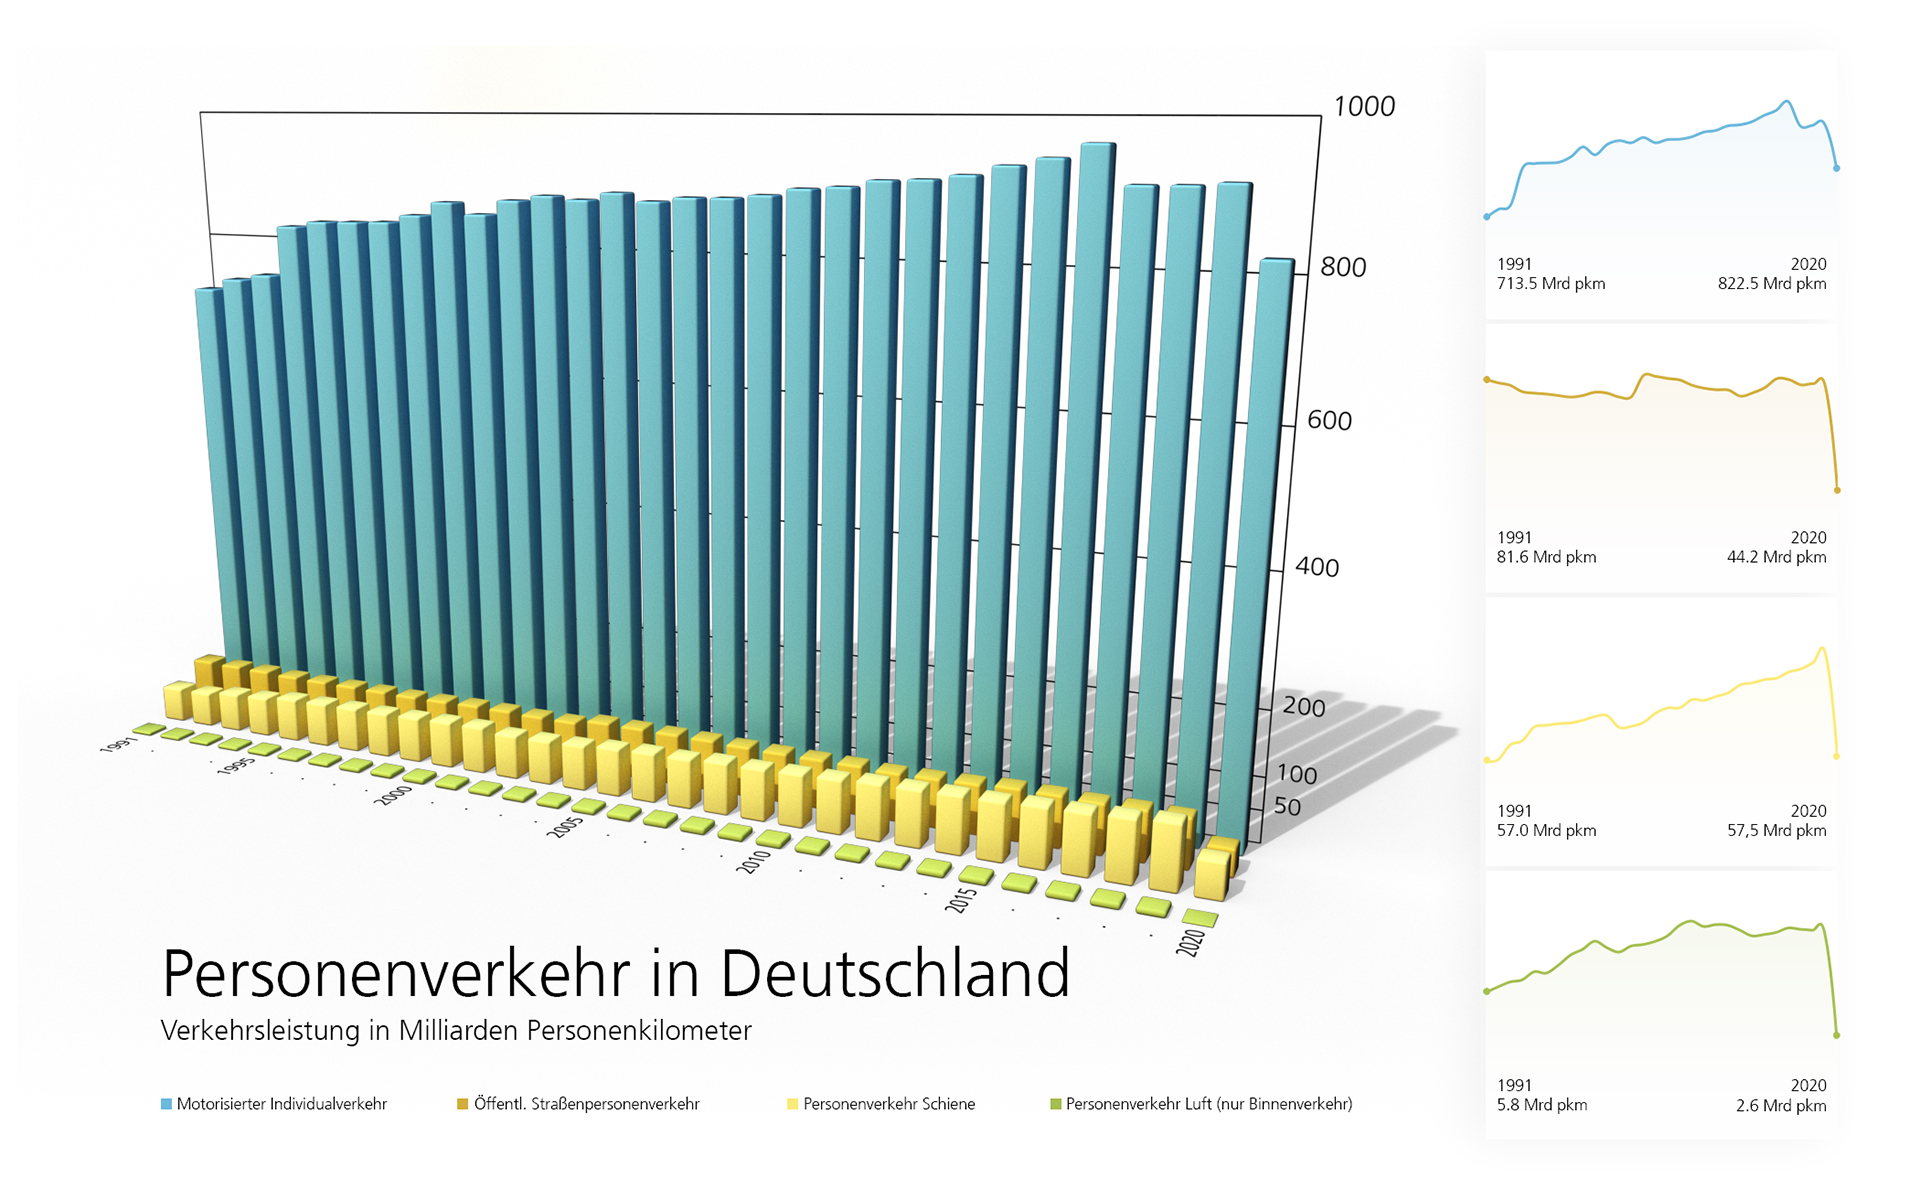
Passenger-kilometres are a unit of measurement for passenger transport performance. Passenger transport performance describes the distance travelled by passengers within a given period. The figures used here are taken from the Federal Ministry of Transport (BMV) – Transport in Figures (Verkehr in Zahlen). Methodology: The transport performance figures presented here are derived from a Germany-wide, representative survey of travel behaviour (Mobility in Deutschland; MiD). This data is updated annually based on additional, up-to-date statistical indicators and trends using model-based predictions.
Sustained, moderate growth
- In 2020, an total of approximately 926.8 billion passenger-kilometres were travelled. This figure is lower than the 1108.4 billion passenger-kilometres recorded in 2019, due to the COVID-19 pandemic.
- Over the past 30 years, passenger transport has grown steadily at a moderate rate, starting from 857.9 billion passenger-kilometres in 1991.
Background: Growth in transport performance is primarily driven by the growth of motorised private transport. Each year, the number of cars increases by half a million vehicles. People with access to their own car travel more and cover longer distances, increasing transport performance. - The slightly lower figures for the years 2017–2019 are due to methodological adjustments to the passenger transport model during this period.
- Motorised private transport is by far the dominant mode of transport in Germany. In 2019, before the COVID-19 pandemic, it accounted for approximately 83 percent of total passenger transport. Public road passenger transport accounted for seven percent, rail passenger transport for nine percent and air passenger transport for one percent.
Note: The COVID-19 pandemic further shifted this ratio in favour of motorised private transport (see the DLR study series).
Motorised private transport:
- In 2020, a total of 822.5 billion passenger-kilometres were travelled.
- Over the past 30 years, motorised private transport has increased steadily: from a high of 713.5 billion in 1991 to 917.4 billion passenger-kilometres in 2019 (2020, the year of COVID-19 pandemic: 822.5 billion). This represents an increase of more than 20 percent.
- The sharp increase in the 1990s and the lower figures for the years 2017 to 2019 are also due to methodological factors.
Public road transport (bus, tram, underground):
- In 2020, approximately 44.2 billion passenger-kilometres were travelled using public road passenger transport. In 2019, before the pandemic, the figure stood at 78.9 billion passenger-kilometres.
- Over the last 30 years, the transport volume of buses, trams and underground services has remained more or less stable. In 1991, the figure stood at 81.6 billion.
Rail passenger transport (S-Bahn, regional trains, Interregio, IC and ICE):
- In 2019, more than 100 billion passenger-kilometres were travelled by rail. This figure fell to 57.5 billion passenger-kilometres in 2020 due to the COVID-19 pandemic.
- Over the last 30 years, rail travel has increased steadily, with the number of passenger-kilometres nearly doubling from the baseline figure of 57 billion in 1991.
Air passenger transport:
- In 2019, air passenger traffic performance was approximately 10 billion passenger-kilometres. In 2020, this figure dropped to 2.6 billion passenger-kilometres due to the extensive restrictions imposed during the COVID-19 pandemic.
- Over the past 30 years, air passenger transport performance has doubled – starting from 5.8 billion passenger-kilometres in 1991. Slight declines were recorded in 2001–2002 following the terrorist attacks in the USA, and again from 2008 to 2010 during the global economic and financial crisis.
Background: Increased supply and lower prices due to the rise of low-cost airlines. - Methodological note: These figures refer to flights that begin and end in Germany.
Carbon dioxide equivalents of passenger transport in Germany
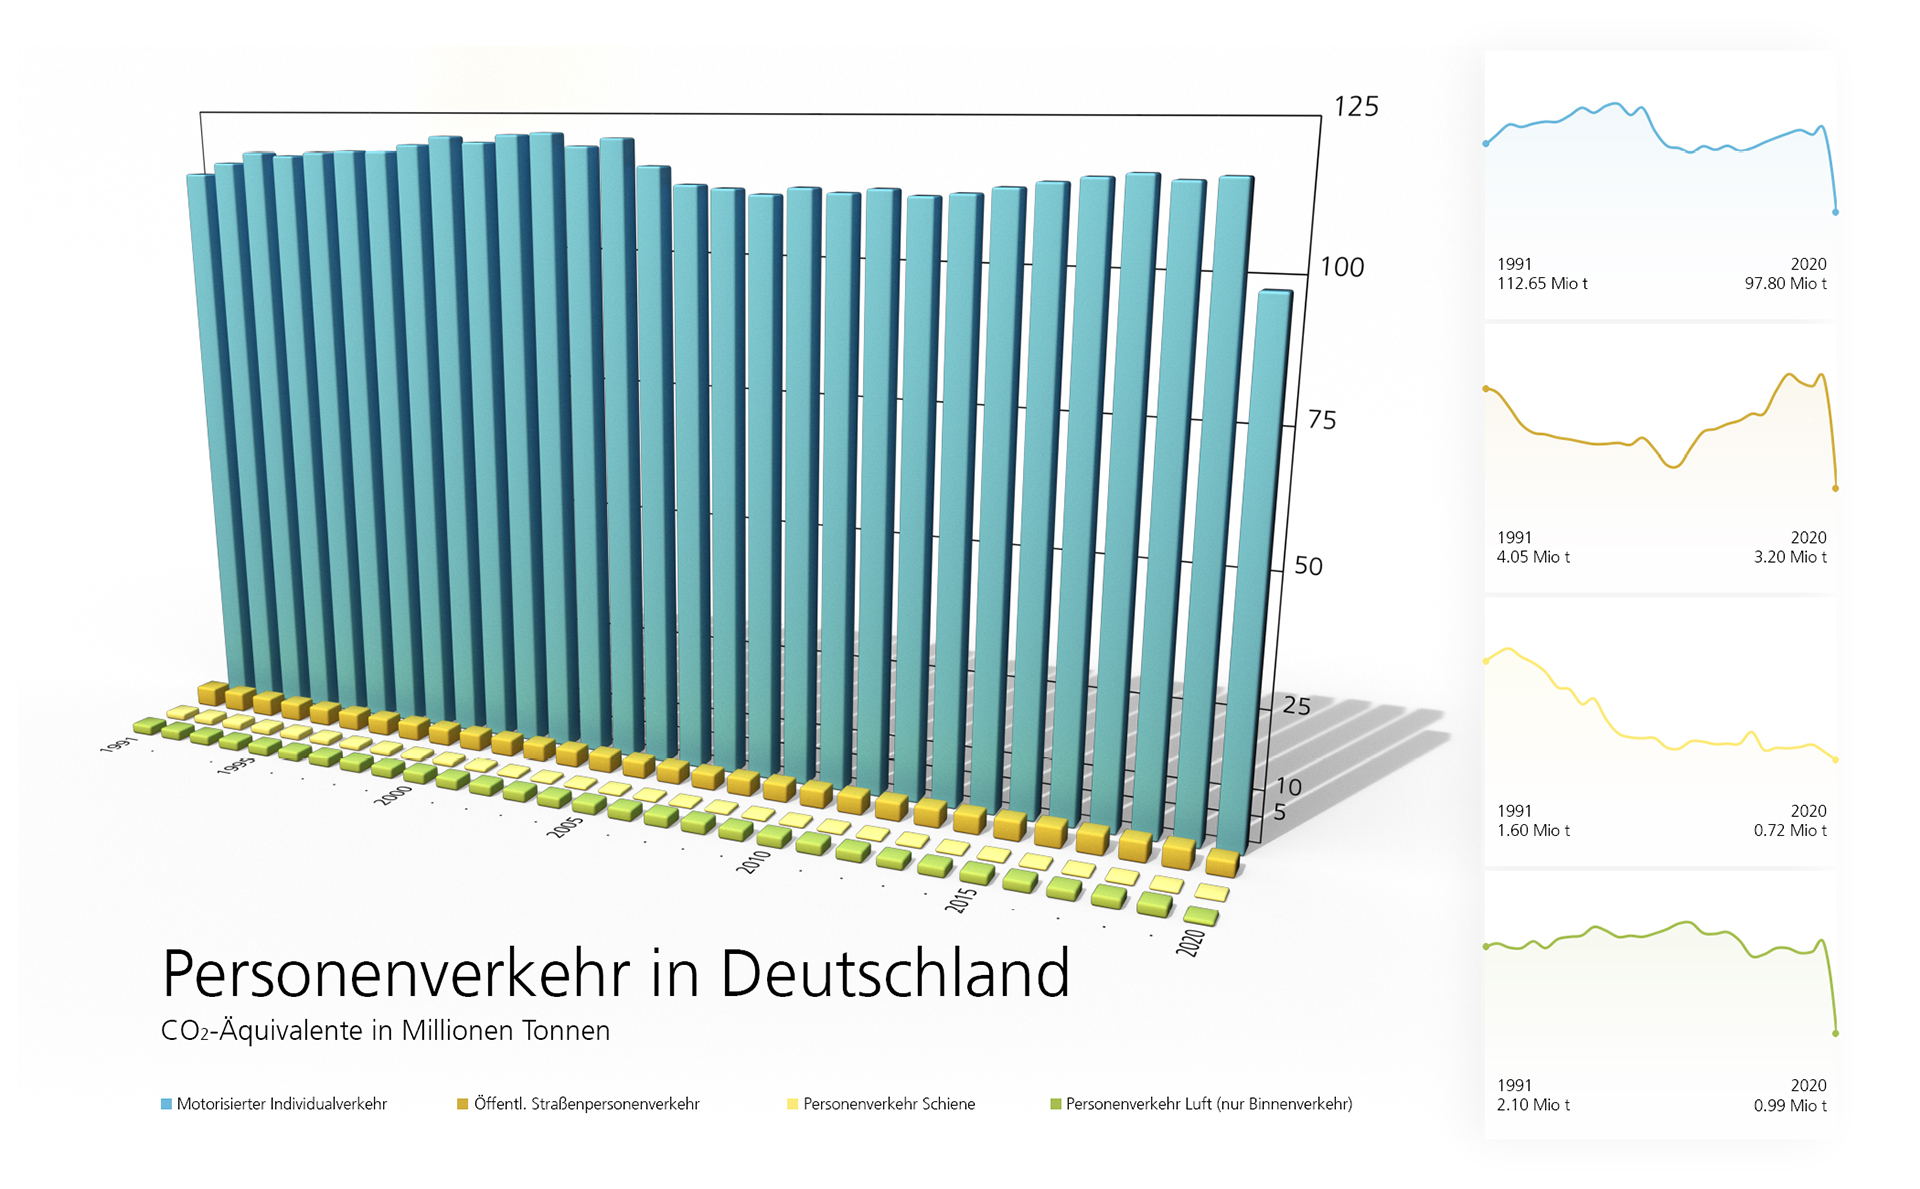
The graph shows carbon dioxide equivalents (CO2e) – a unit of measurement used to standardise the climate impact of different greenhouse gases. It includes the greenhouse gases carbon dioxide (CO2), methane (CH4) and nitrous oxide (N2O). Non-CO2 effects, which play a role in air transport, are not included. The CO2e emissions are calculated based on vehicle-specific emission factors and the corresponding transport performance. The model used for this is the Transport Emission Model (TREMOD 6.21: Development of CO2e emissions for domestic transport) from the Institute for Energy and Environmental Research (Institut für Energie- und Umweltforschung; ifeu), which performs the calculations for the German Environment Agency (Umweltbundesamt; UBA).
Slight declines due to efficiency gains until the mid-2000s, followed by relative stability
- In 2019, CO2e emissions from passenger transport totalled 122.76 million tonnes. This figure was significantly lower in 2020, at 102.70 million tonnes, due to the COVID-19 pandemic.
- Until the mid-2000s, CO2e emissions fell, mainly due to a reduction in average specific emissions per kilometre. This reduction was driven by the increasing share of diesel vehicles in the fleet – particularly among high-mileage users – and by technological improvements in efficiency. By the mid-2000s, these effects had been exhausted and progress stalled. The number of large vehicles increased, particularly Sport Utility Vehicles (SUVs), and total mileage continued to rise. Alternative drive systems are still negligible in this context.
- Motorised private transport dominates CO2e emissions by a very wide margin. In 2019, before the COVID-19 pandemic, it accounted for approximately 94 percent of total passenger transport CO2e emissions. Public road passenger transport accounted for three percent, rail passenger transport one percent and air passenger transport two percent (rounded figures).
Motorised private transport:
- In 2019, motorised private transport generated just over 115 million tonnes of CO2e emissions. In 2020, the year of the COVID-19 pandemic, this figure was 97.80 million tonmes.
- Over the past 30 years, emissions have increased only slightly: from 112.65 million tonnes in 1991 to approximately 115 million tonnes of CO2e, even though transport volume has increased by more than 20 percent..
Public road transport (bus, tram, underground):
- In 2019, buses, trams and underground trains emitted a total of 4.13 million tonnes of CO2e. By 2020, this figure had fallen to 3.20 million tonnes.
- Over the past 30 years, the trend has been relatively constant, with slight declines through the end of the 2000s followed by a slight rise back to previous levels – partly due to the liberalisation of the long-distance bus market.
Passenger rail services (S-Bahn, regional rail, Interregio, IC and ICE):
- In 2019, passenger rail transport emitted 0.80 million tonnes of CO2e. In 2020, the figure was 0.72 million tonnes.
- In 1991, the figure was 1.60 million tonnes. CO2e emissions have since halved, despite the fact that transport performance has nearly doubled.
- Background: Increasing electrification of railway lines, reduced use of diesel train sets and, where applicable, the decommissioning of non-electrified lines as part of the railway reform started in 1994.
Passenger air transport:
- In 2019, domestic passenger air transport in Germany emitted approximately 2.14 million tonnes of CO2e. Due to the massive decline in air traffic caused by the COVID-19 pandemic, the figure for 2020 was 0.99 million tonnes.
- Over the past 30 years, emissions have remained relatively constant, despite an increase in transport performance of almost 80 percent. The baseline value in 1991 was 2.10 million tonnes of CO2e.
- Background: More efficient and often very new aircraft (fleet renewal), increased load factors, improved routing.