Despite the influence of weather patterns, the effect of the Coronavirus on air quality is now visible
May 5, 2020 | Earth observation using satellites
Despite the influence of weather patterns, the effect of the Coronavirus on air quality is now visible
Comparison of nitrogen dioxide emissions over Europe between March/April 2019 and 2020
The Benelux countries, West Germany, Northern Italy, the southern United Kingdom, as well as hotspots like the Po Valley, Madrid, Paris, Milan and Rome show a decrease of tropospheric nitrogen dioxide of more than 40 percent compared to the previous year. The aforementioned weather-related fluctuations were reduced by the creation of monthly averages. These averages were calculated for the period 16 March to 15 April. No adjustment of the weather influence by the combination of long-term satellite observations, in-situ measurements and model calculations as described in the text was made.
Comparison of Sentinel-5P recordings of nitrogen dioxide emissions over Asia between 2019 and 2020
The high-resolution data from Sentinel-5P also show a decrease in nitrogen dioxide over Asia of more than 40 percent in some cases, compared to the previous year. The decrease is not limited to large cities. Even Mumbai and Delhi in India show a decrease in the order of 40 to 60 percent compared to 2019. The above-mentioned weather-related fluctuations were reduced by creating monthly averages. An adjustment of the weather influence by the combination of long-term satellite observations, in-situ measurements and model calculations described in the text was not carried out here.
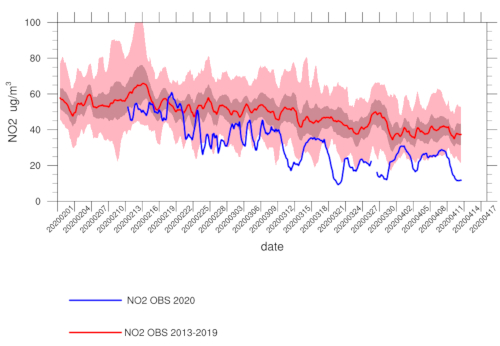
Measurements of the nitrogen dioxide concentration in the ambient air at 25 ground stations in Lombardy from 15 February to 15 April as an average over the years 2013 to 2019 (red line), and for the year 2020 (blue line). The grey shaded area shows the standard deviation (dispersion), the light red area shows the minimum and maximum value range of the previous years.
Half of humanity is being affected by the lockdown measures implemented as a result of the Coronavirus pandemic. The strong global decrease of nitrogen dioxide (NO2) concentrations, when compared to the levels detected over the previous year by the European Sentinel-5P satellite is therefore not surprising. Nitrogen oxides are an indicator of air pollution from industrial and transport activities.
However, the comparison is deceptive. This year, polar winds over large parts of Europe and a persistent westerly wind, which prevented the accumulation of pollutants, already provided unusually clean air. Assessing the impact of the Coronavirus on this is therefore complex. Researchers from the German Aerospace Center (Deutsches Zentrum für Luft- und Raumfahrt; DLR) Earth Observation Center (EOC) have obtained scientifically sound evidence of the 'Corona' effect.
Long-term analyses and the influence of the weather
The European satellite MetOp-A has been providing daily measurements of the global distribution of pollutants for many years. Long-term analyses show that there have always been strong, weather-related fluctuations in the density of the air pollutant nitrogen dioxide. The satellite examines the entire atmosphere. At higher altitudes, winds can transport air pollutants, dilute them or distribute them to distant regions. Therefore, these measurements alone are not sufficient. Near ground level, winds and precipitation displace or wash out pollutants. Measurement data from ground stations alone are therefore also not sufficiently conclusive.
The Lombardy region in Italy was impacted by the Coronavirus outbreak at an early stage. Starting on 8 March 2020, the Italian government began adopting quarantine measures, which evolved rapidly. Accordingly, satellite and ground measurements since the lockdown show a deviation from the long-term average. This is a preliminary indication.
But how do DLR scientists take the influence of the weather into account? For this purpose, the pollution levels are simulated using computers.
The scientists start their analyses using emission values of pollutants that are averaged over several years and represent the normal situation. This ensures that the model does not include the Coronavirus-conditioned measures. However, it takes into account the real weather conditions from hour to hour. This is followed by a comparison with this year's measured data. The modelled, normal situation is subtracted from the actual ground measurement values. Then, the lockdown in Lombardy reveals a real reduction of nitrogen dioxide concentration by approximately 20 micrograms per cubic metre. This is a 45 percent decrease.
Only satellites enable the continuous global measurement of pollutants. This investigation shows how well these measurements fit with ground data and models. However, only a combined analysis of satellite measurements, in-situ data and computer modelling can provide scientific proof of the ‘Corona effect’. The atmospheric events are too complex for generalised assessments. This becomes clear in other regions of the world. There, the current measured values are, in part, within the fluctuation range of recent years. Whether this is due to special local weather conditions or to a later start of lockdown measures remains unclear without detailed investigations.
The analysis for Lombardy was carried out using data from the European satellite MetOp-A. Since 2018, the European satellite Sentinel-5P has been providing measurements at a much higher resolution. In the future, these will help to better trace emission sources and pollutant transport mechanisms. Long time series are still not available, so that only comparisons between 2019 and 2020 are possible. In order to at least reduce the impact of the weather, DLR has established global monthly averages. For this purpose, 1.2 trillion individual measurements were processed over two months using DLR algorithms and tested for quality. These data also show – although not weather-independent – a clear reduction in emissions. The data generated at DLR are used, among other things, in the S-VELD project, which is funded by the German Federal Ministry of Transport and Digital Infrastructure, to analyse the impact of traffic emissions on air quality in Germany.
This analysis includes data from the Copernicus Sentinel-5 Precursor satellite (2019-2020) processed and modified by DLR.
The operational GOME-2 data are provided by DLR as part of the EUMETSAT AC-SAF project.


