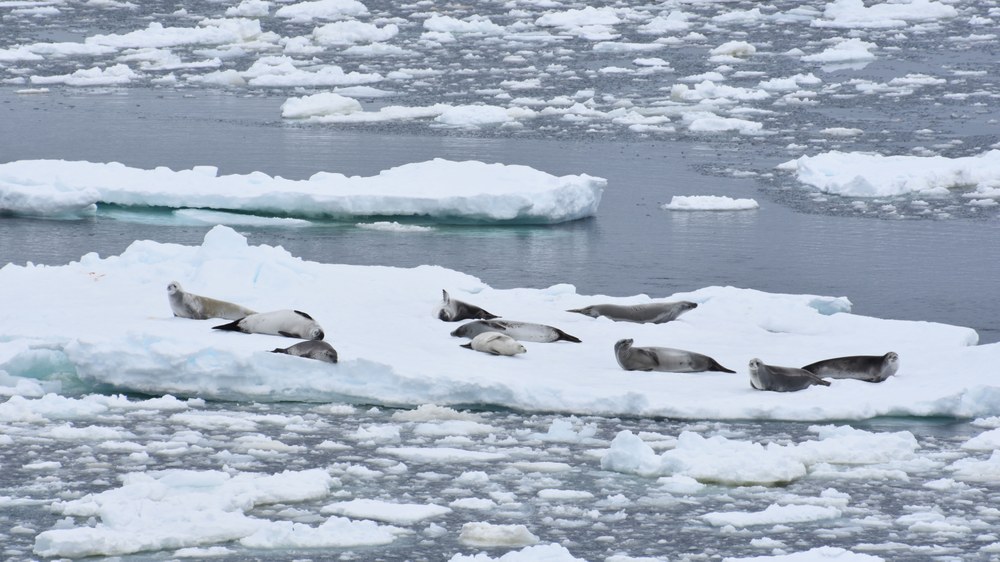
The decline in sea ice also affects their habitat.
Image: 5/5, Credit:
Alessandro Toffoli, University of Melbourne
A new algorithm developed at DLR provides the first high-resolution maps that allow conclusions to be drawn about the current thickness of sea ice.
This is made possible by combining data from the European Sentinel-1 radar satellites with measurements from the ATLAS laser altimeter on board NASA's ICESat-2 satellite.
The resulting sea-ice maps have a resolution of 100 metres, surpassing existing maps compiled from altimeter measurements by a factor of 250.
These findings provide a new basis for environmental and climate research.
Focus: Space, Earth observation, climate research, transport, maritime research
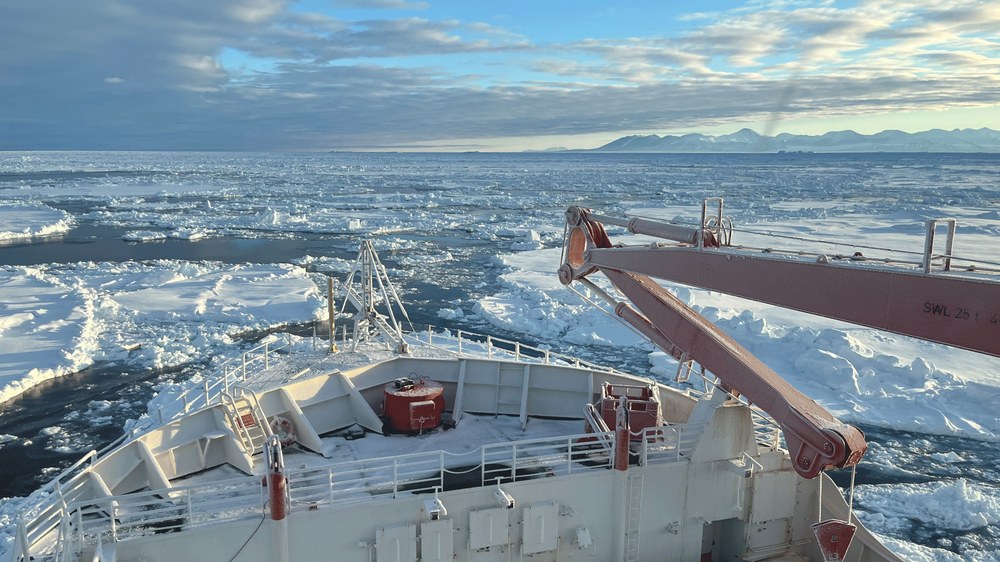
The Arctic is one of the least accessible regions on Earth – yet nowhere else are the effects of global warming more pronounced. Sea-ice cover has been declining for years and the remaining ice is gradually thinning. The German Aerospace Center (Deutsche Zentrum für Luft- und Raumfahrt; DLR) has now developed a new algorithm that combines radar images from the European Sentinel-1 satellite mission with elevation profile measurements from NASA's ICESat-2 satellite, enabling the first high-resolution calculation of ice thickness.
Sea ice plays a significant role in the Earth's climate. White, snow-covered surfaces reflect sunlight back into space. Thinner ice appears darker because it is more transparent and allows the seawater to shine through. As a result, thinner ice also reflects less sunlight back into space, causing temperatures to rise not only in the Arctic, but across the entire globe.
Certain sea-ice properties, such as ice concentration or age, have traditionally been derived from satellite data and have formed the basis of climate research for decades. Until now, satellite images have not been able to comprehensively measure ice thickness. Our new algorithm now provides, for the first time, information on ice thickness that could, for example, significantly improve navigation for ships in polar waters.
How satellites measure sea ice
Laser altimeters installed on satellites measure a height profile along a line beneath the satellite, determining what is known as the 'freeboard' of the ice – the height of the ice above sea level. Altimeters are an important tool in climate research from space – however, they only take measurements in a line. To create comprehensive area-wide maps, all measurements taken over the course of a month must be compiled, resulting in maps with a resolution of just 25 kilometres.
Radar satellites, by contrast, provide area-wide – that is two-dimensional – images of Earth's surface, in which land masses, bodies of water, ice surfaces and various structures within the ice, such as pressure ridges and meltwater, become visible. The size and resolution of the images are adjustable. Typically, a Sentinel-1 image of the Arctic covers an area of 400 by 400 kilometres with a resolution of 40 metres – two images would almost cover all of Germany.
Background information: Laser altimeter and freeboard
Laser altimeter
A laser altimeter is an instrument used to determine the topography or shape of a planet’s surface. The planet in question may be Earth, Mars or even Mercury. A laser altimeter can be operated from an aircraft, helicopter or satellite.
Freeboard
Freeboard is the part of floating ice that protrudes above the water surface. This height, together with other measurements such as snow thickness, is used to calculate the total thickness of the ice floating on the ocean. Measuring freeboard is essential for determining ice volume and plays a crucial role in climate change research.
From the ice surface to ice thickness
Images from radar satellites show 'echoes' of Earth's surface. Orbiting several hundred kilometres above Earth, these satellites transmit a radar signal which is reflected differently depending on the underlying surface. The satellite then measures and analyses these reflected echoes and combines them into an image showing the surface of land and ice. However, these radar images from space depict only the surface properties of the ice — not its thickness.
The new algorithm developed by the DLR Remote Sensing Technology Institute in Bremen achieves precisely this. By matching radar signals with altimeter data, the algorithm assigns ice thickness information to the radar signal. The algorithm then generates ice maps showing the height or thickness of the ice above sea level – the freeboard. When snow and density information are added, the total ice thickness can be calculated.
In a recent study, the researchers demonstrated the effectiveness of the new algorithm. The resulting sea ice maps have a resolution of 100 metres – 250 times higher than previous maps compiled from monthly altimeter measurements. For the first time, subtle topographical differences within the ice are visible across entire regions.
Tracking the movements of ice
The European Sentinel-1 radar satellites fly in a near-polar orbit, allowing them to image regions at high latitudes particularly frequently – some Arctic waters even several times a day. This is crucial, as wind and ocean currents constantly reshape the ice. Within hours, ice floes can be pushed together and open water can close. If the pressure persists, ice floes can pile up on top of or beneath one another or even stand upright. The resulting pressure ridges can be several metres thick. In contrast, a closed ice cover can break apart and be eroded by opposing forces.
The new algorithm based on Sentinel-1 images therefore not only allows conclusions to be drawn about ice thickness at much higher resolution, but also at a much faster rate. The resulting ice charts reveal in great detail the constantly changing topography of the oldest floes in the Arctic. They thus provide not only a new foundation for environmental and climate sciences, but could also revolutionise shipping in the Arctic. Routes that cross thinner ice are more efficient and safer.
The study for the new algorithm was carried out in collaboration with the Danish Meteorological Institute (DMI) and the University of Bremen.
DLR is currently planning a research project together with Drift+Noise Polar Services to investigate how suitable these new ice charts are for ship-routing. The thickness of the ice – even just the part above the water – is critical information for ship crews, and has never been available in this way before.

