11 August 2022 | Facts and figures for journalistic research and public debateOffshore wind energy – number of turbines, capacity and outlook
The third part in the 'Facts and Figures' series provides insights into the field of offshore wind energy. Offshore wind turbines will play a key role in the climate-compatible energy system of the future, which is based on electricity and heat from renewable sources. Accordingly, expansion targets in Germany, the European Union and countries in Asia are highly ambitious. This compilation focuses primarily on data relating to offshore wind installations currently in operation or under construction, as well as their installed capacity.
Methodology
The figures presented in this article were compiled by researchers at the German Remote Sensing Data Center (DFD) at DLR's site in Oberpfaffenhofen using time-series data from imagery captured by ESA's Sentinel-1 radar satellite – spanning July 2016 to June 2021. To analyse this data, researchers developed specialised algorithms using artificial intelligence to automatically identify offshore wind turbines within the vast Sentinel-1 archive. For the first time, this approach enables a comprehensive global overview of the offshore wind energy sector. An impression of this can also be gained from the digital offshore wind energy map created as part of the project.
Number of offshore wind turbines worldwide (as of June 2021)
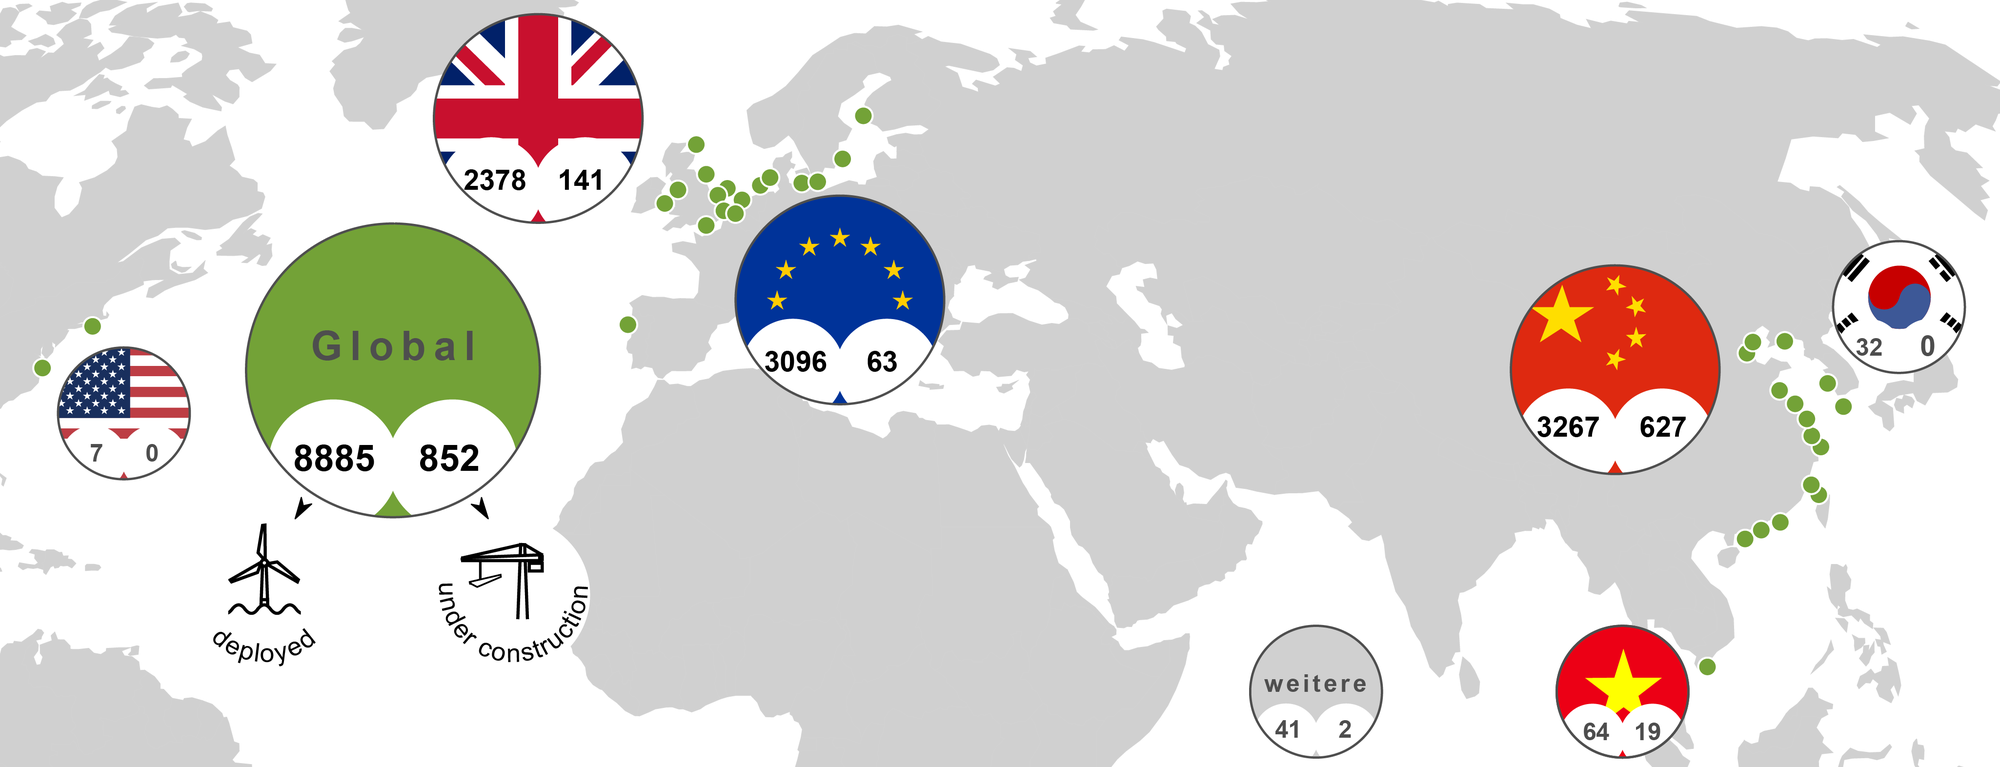
- As of June 2021, nearly 9000 offshore wind turbines were in operation worldwide.
-
In terms of the number of installations, China ranks first (3267), followed by the EU (3096) and the United Kingdom (2378). Vietnam is in fourth place (64), followed by South Korea (32) and the United States (7).
-
At that time, more than 850 turbines were under construction – by far the largest share of these were in China (627), followed by the United Kingdom (141) and the EU (63).
-
In percentage terms, 37 percent of all offshore wind turbines are located in China, 35 percent in the EU and 27 percent in the United Kingdom (figures rounded).
-
Of the turbines under construction as of June 2021, 74 percent were in China, 17 percent in the United Kingdom and 7 percent in the EU (figures rounded).
|
|---|
Development 2016–2021 – number of offshore wind turbines worldwide
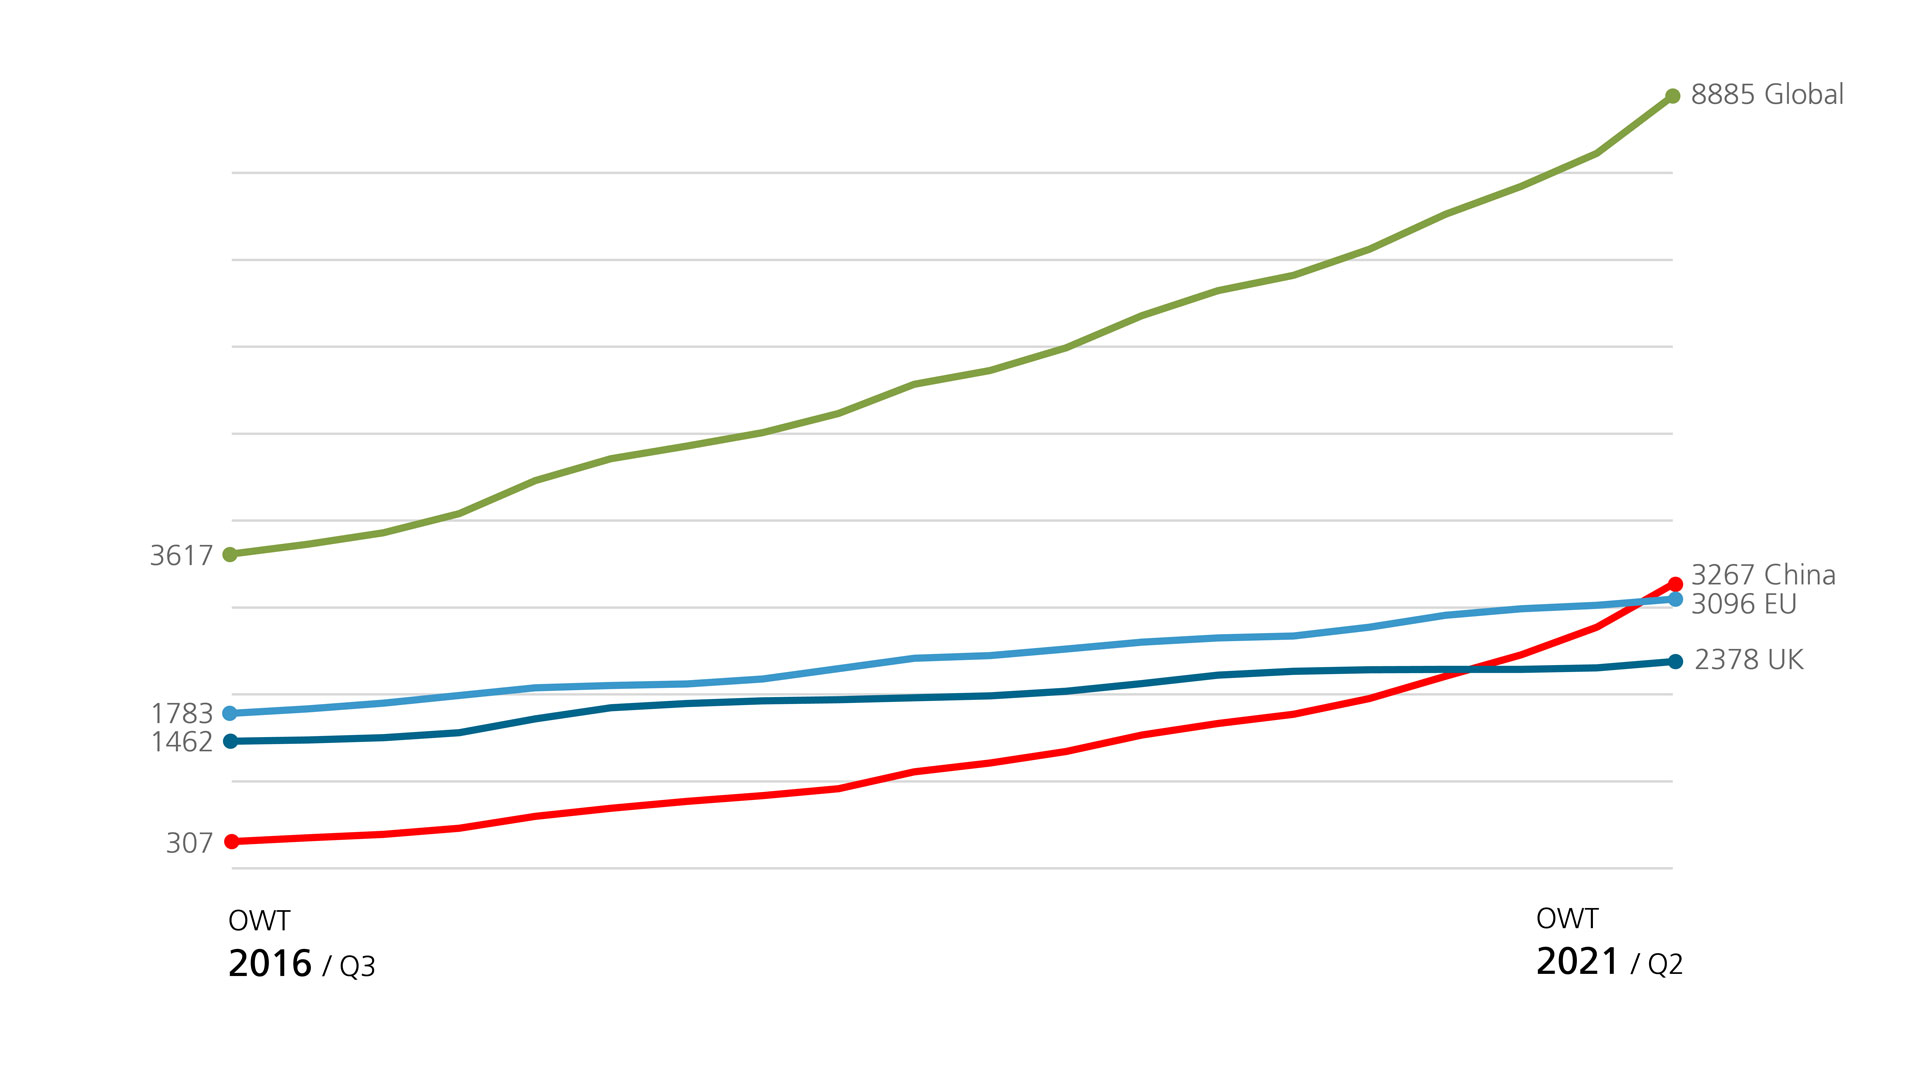
- Over the five-year period from July 2016 to June 2021 inclusive, the number of offshore wind turbines worldwide grew from 3617 to 8885 – an increase of nearly 150 percent.
-
Among individual countries and regions, China saw by far the greatest growth in offshore wind energy over this period: with the number of turbines increasing more than tenfold from 307 to 3276 – a rise of almost 970 percent.
-
The EU recorded the second-highest growth at 74 percent (from 1783 to 3096 turbines), followed by the United Kingdom in third place with 63 percent growth (from 1462 to 2378 turbines).
-
Growth in the remaining countries combined stood at 122 percent (from 65 to 144 turbines).
-
Conclusion: China is overwhelmingly responsible for the growth in global offshore wind energy, followed at a considerable distance by the EU and the United Kingdom.
|
|---|
Installed capacity of offshore wind turbines worldwide (as of June 2021)
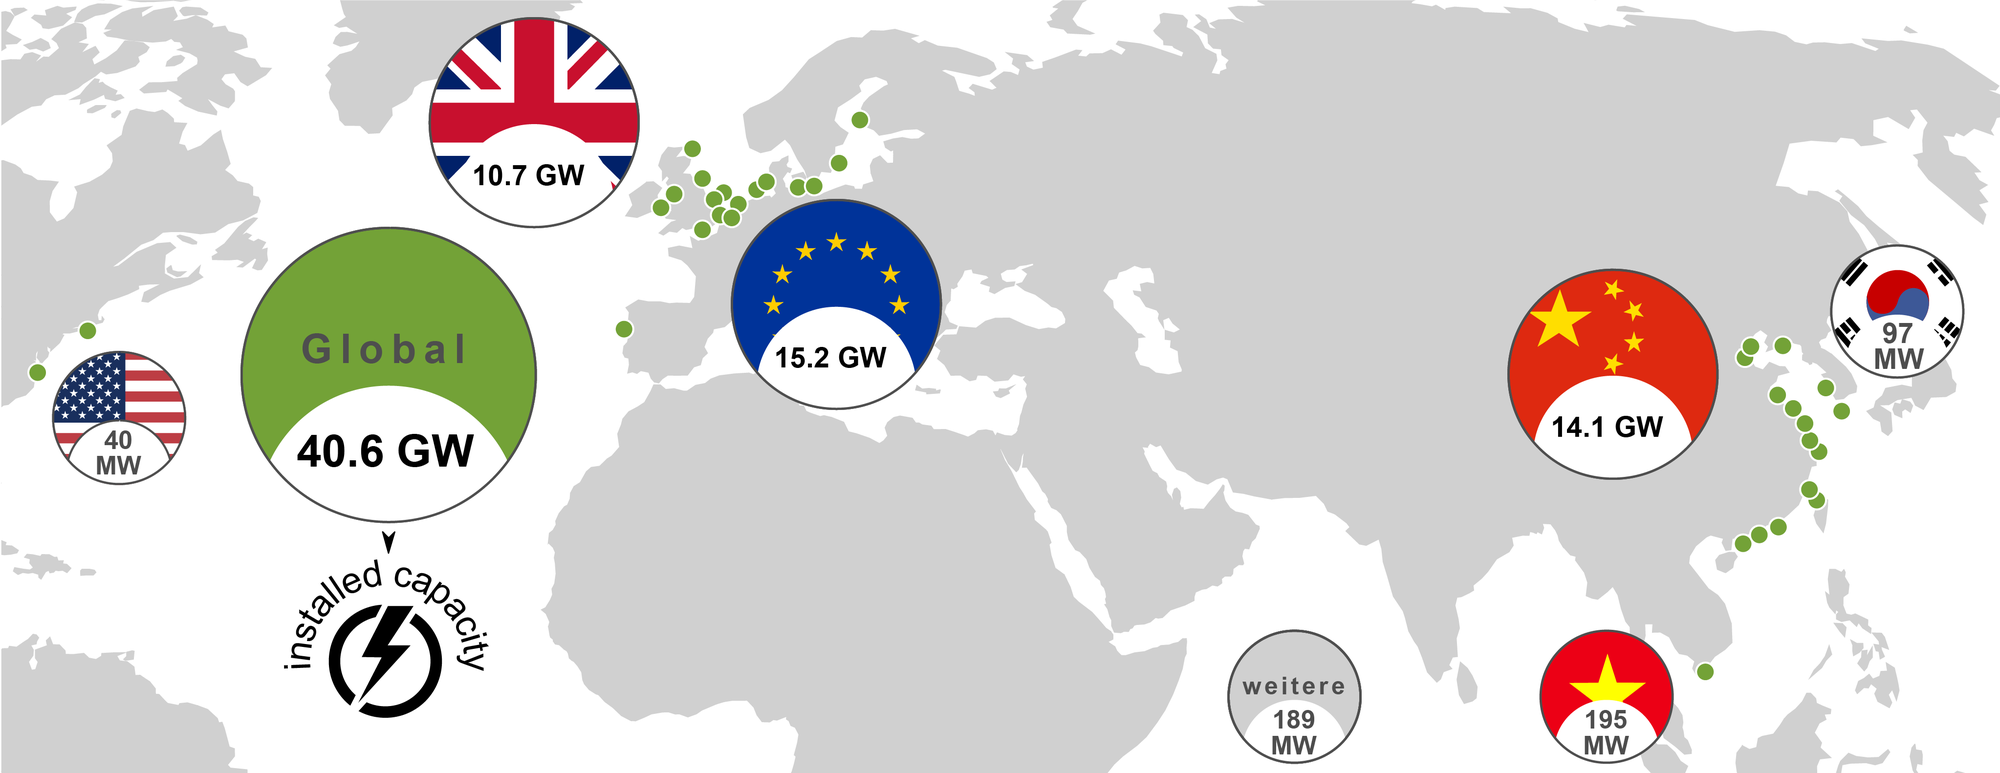
- Installed capacity refers to the maximum technical capacity of the generators installed in wind turbines. Actual power output may vary depending on weather conditions, time of year and maintenance work.
-
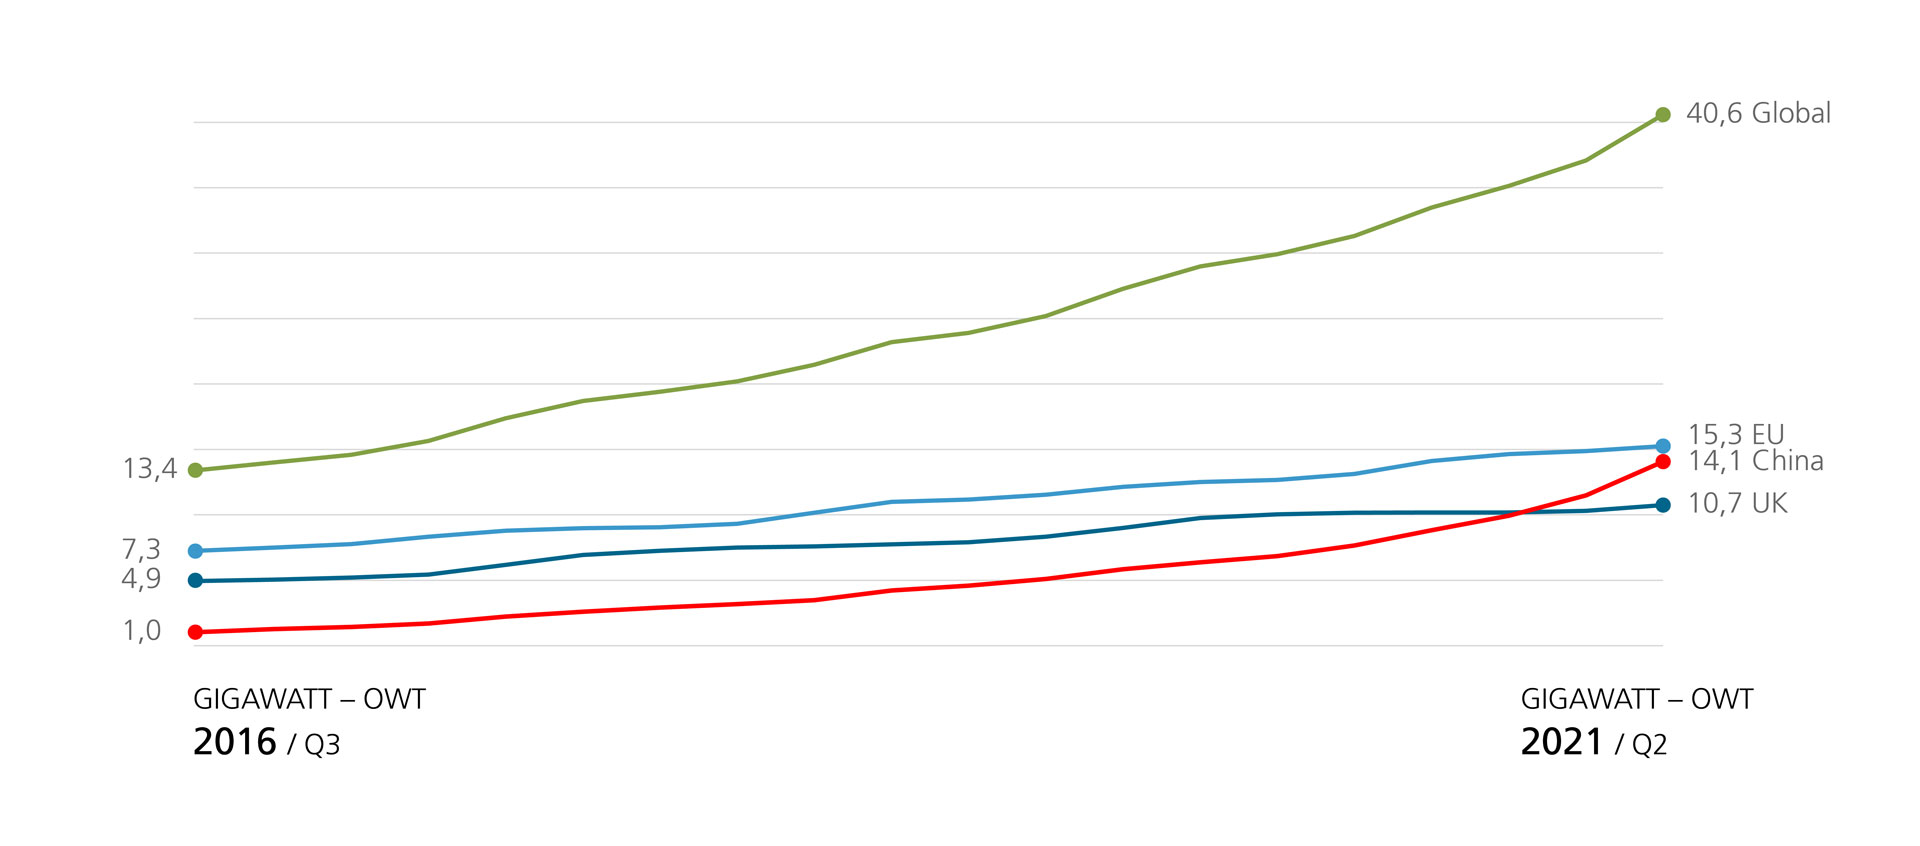
As of June 2021, the globally installed capacity stood at 40.6 gigawatts.
-
For comparison: The three nuclear power stations still operating in Germany at that time had a combined installed capacity of approximately 4 gigawatts.
-
As of June 2021, the EU had the highest installed capacity with approximately 15 gigawatts, closely followed by China (14.1 gigawatts) and, with some distance, the United Kingdom (10.7 gigawatts). Due to the completion of a large number of wind installations in the second half of 2021, China's capacity is expected to have significantly exceeded that of the EU by the end of that year.
-
All other countries have installed capacities only in the megawatt range.
-
In percentage terms, this means that as of June 2021, the EU accounted for 37 percent of global installed offshore wind capacity, followed by China with 35 percent and the United Kingdom with 26 percent (figures rounded).
|
|---|
Development 2016–2021 – installed capacity of offshore wind turbines worldwide
- Over the five-year period from July 2016 to June 2021 inclusive, total installed capacity worldwide increased by approximately 200 percent – in other words, it tripled from 13.4 to 40.6 gigawatts.
-
Among individual countries and regions, China recorded by far the greatest growth in installed capacity over this period at 1310 percent (from 1 to 14.1 gigawatts).
-
The United Kingdom saw the second highest increase of 118 percent (from 4.9 to 10.7 gigawatts), followed by the EU in third place at 108 percent (from 7.3 to 15.2 gigawatts).
-
Growth across all other countries combined increased by 150 percent, from 0.2 to 0.5 gigawatts.
|
|---|
Outlook – installed capacity of offshore wind turbines and policy targets (EU and UK)
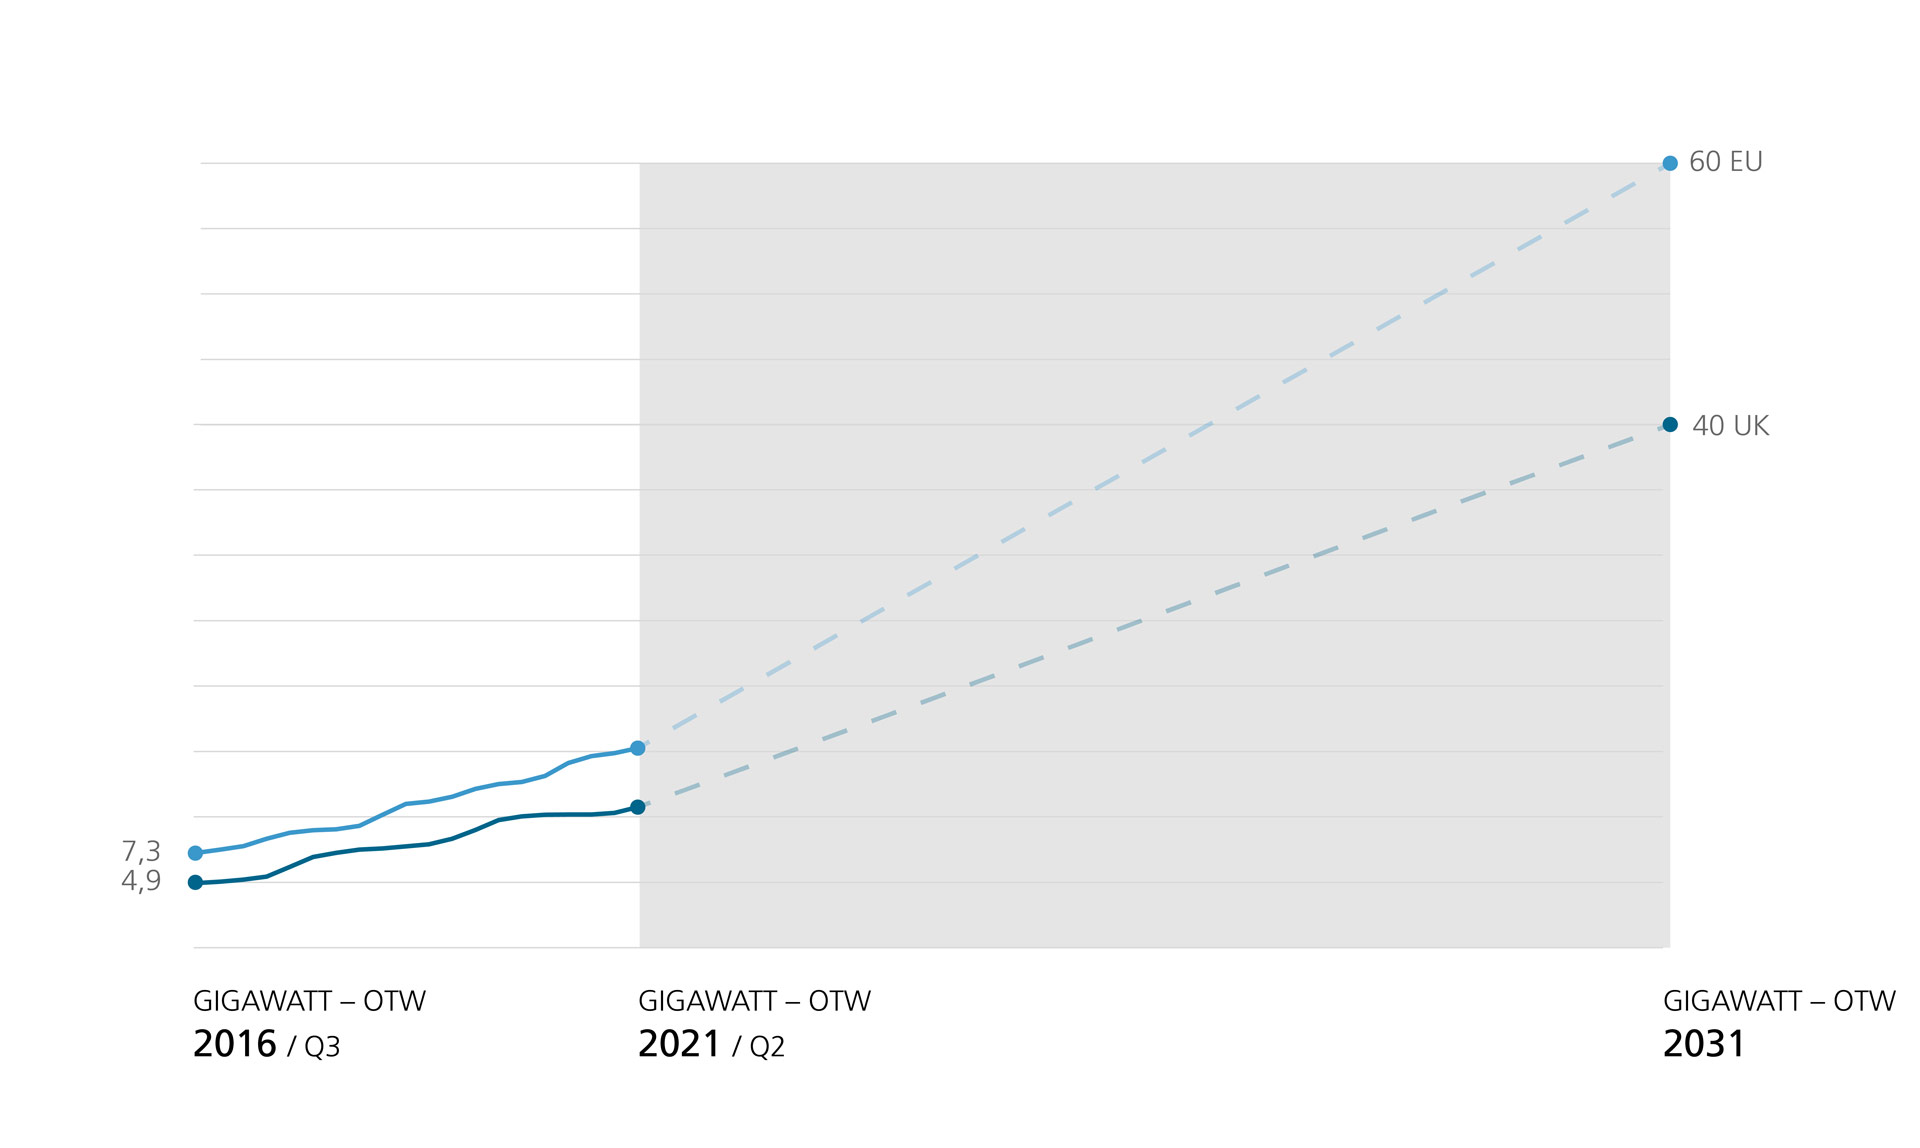
- According to the European Commission, the target for offshore renewable wind generation stands at at least 60 gigawatts by 2030.
-
Currently, the installed capacity of offshore wind turbines in the EU stands at 15.2 gigawatts – meaning it will need to increase roughly fourfold in less than ten years.
-
The situation is similar in the United Kingdom: here, the British government aims to expand capacity to 40 gigawatts (as of October 2021).
-
Currently, installed capacity stands at 10.7 gigawatts, meaning a fourfold increase will also be required in less than ten years.
|
|---|
Related articles


